Integrating Microsoft Sentinel
Microsoft Sentinel is a cloud-native security information and event management (SIEM) solution for proactive threat detection, investigation, and response. You can integrate Microsoft Sentinel with the Delinea Platform by using webhooks.
Prerequisites
Ensure that the following requirements for the integration are met:
-
Admin access to the Delinea Platform to configure a webhook endpoint.
-
Azure subscription with Microsoft Sentinel enabled on a Log Analytics workspace in a supported region.
-
Access to the Microsoft Sentinel portal.
-
Admin access to Log Analytics with the permission to create a workspace.
This integration does not rely on the deprecated Log Analytics Agent, which was retired on August 31, 2024. Instead, it leverages HTTP requests to trigger Azure Logic Apps workflows that generate custom log entries or alerts in Microsoft Sentinel. This integration does not depend on either the deprecated Log Analytics Agent or the Azure Monitor Agent (AMA), ensuring a modern, agentless solution.
Configuration
To configure this integration, perform the following steps:
Step 1: Configuring Microsoft Sentinel
You can configure the Microsoft Sentinel integration in one of three ways:
-
Option 1: Configuring Microsoft Sentinel Using a Logic App: This method uses the HTTP Data Collector API to forward log data to Microsoft Sentinel.
OR
-
Option 2: Configuring Microsoft Sentinel Using a DCR: This method uses a data collection rule (DCR) in Azure Monitor, configured manually.
OR
-
Option 3: Configuring Microsoft Sentinel Using a DCR ARM Template (Recommended): This is the recommended method. It uses an ARM template to automatically provision all required Azure resources in a single deployment.
Option 1: Configuring Microsoft Sentinel Using a Logic App
This configuration method involves creating a logic app in Microsoft Sentinel and setting up a log analytics workspace.
Creating a Logic App in Microsoft Sentinel
To create a logic app:
-
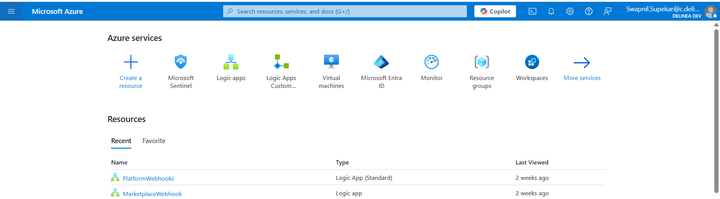
Log in to the Azure portal dashboard.
-
In the services section, select Create a resource.
-
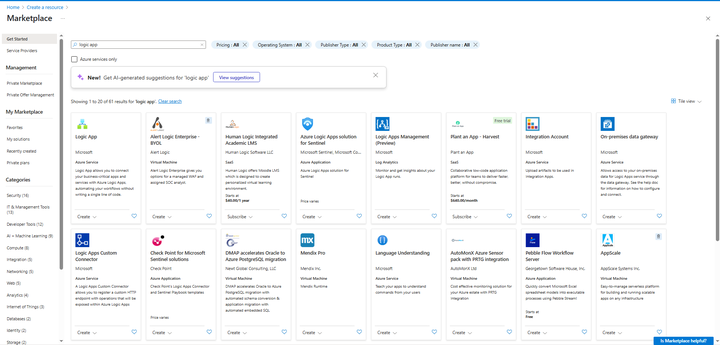
Enter Logic App in the search area, and then select Logic App.
-
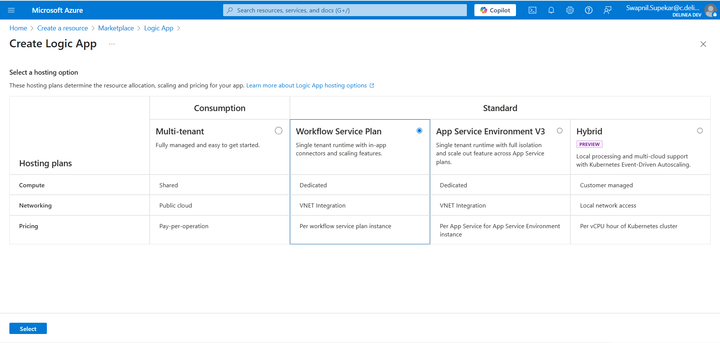
Select Create.
-
Select the Workflow Service Plan check box.
-
Click Select.
-
Fill in the required information for your Logic App and select Review + Create.
-
Once the deployment is done, your Logic App is created in Sentinel.
Setting Up a Sentinel Log Analytics Workspace
To set up a Sentinel log analytics workspace:
-
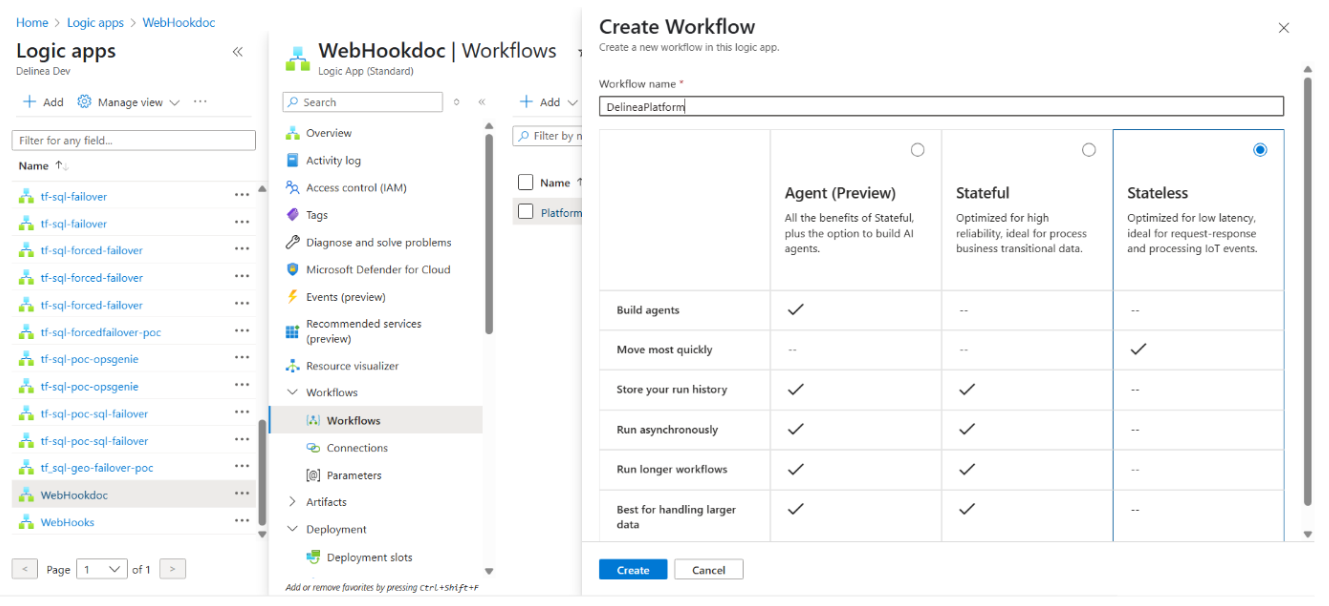
In the Logic App, go to Workflows and select Add to add a new workflow. The Create Workflow window opens.
-
Enter the Workflow Name and select Stateless as the state type.
-
Select Create. Note: Depending on screen resolution, the Create button might be hidden at the bottom of the app tile.
-
Open the newly-created workflow.
-
Navigate to Tools > Designer.
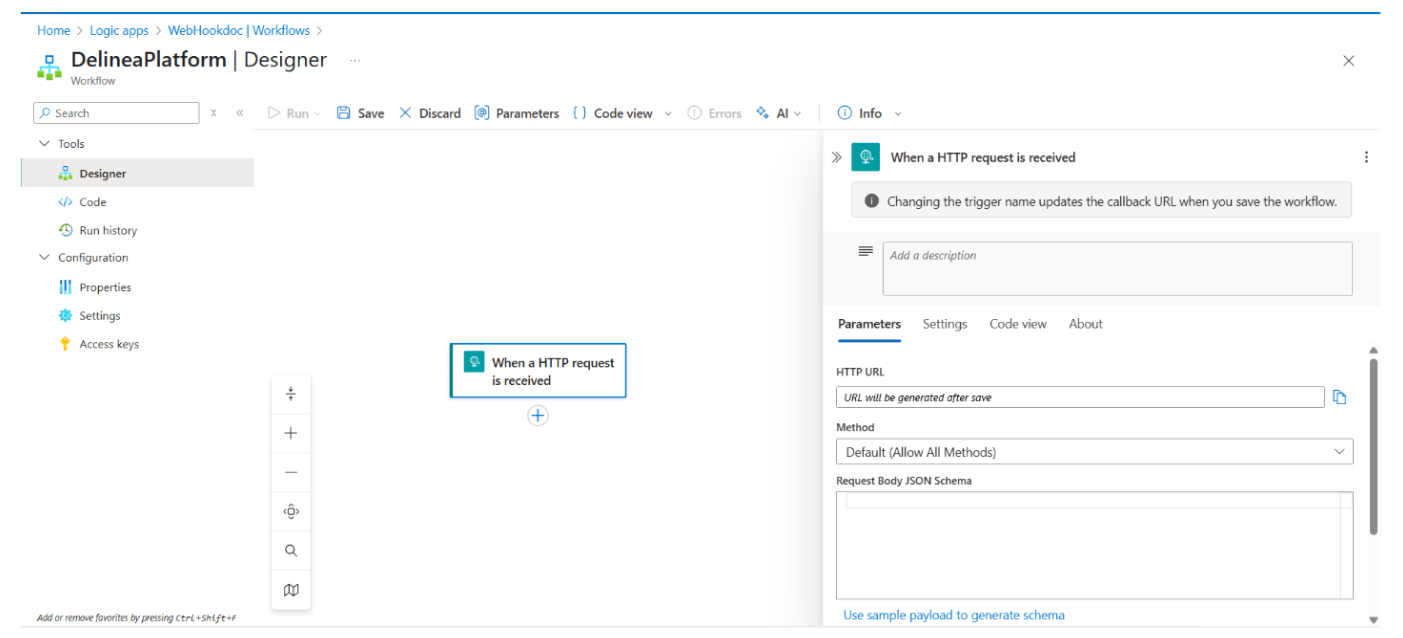
-
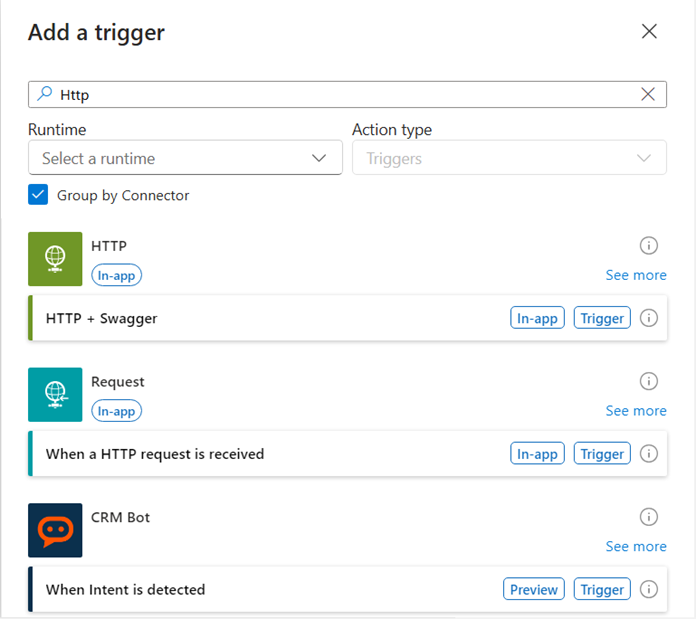
On the Designer page, select the plus sign, then select Add trigger.
-
Search for "HTTP" and select When an HTTP request is received in the Request section. You will use this trigger later when setting up a webhook on the Delinea Platform.
-
Select the Use sample payload to generate schema hyperlink.
-
Paste the following code into the field. (Alternatively, you can retrieve the schema payload from the Marketplace > Test webhook Request body):
Copy{
"AuditEventMessageId": "87b928df-ccc5-46ed-8cc5-b2e88866a2b5",
"TenantId": "7968fc7c-9205-4bd8-ad41-1432ffb8f7d3",
...
"ForceCompress": false
} -
Select Done, then select Save.
-
Select the plus sign and then select Add an action.
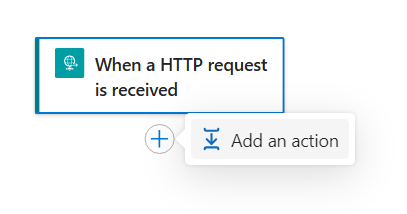
-
Search for "Log Analytics" and select Send Data. The Create a connection page opens.
-
Provide the Workspace ID and Shared Key. Where to Find Your Workspace ID and Key:
-
In the Sentinel portal, go to Home > Microsoft Sentinel.
-
Navigate to Settings > Workspace settings > Settings > Agents.
-
Click the arrow icon to expand the Log Analytics agent instructions.
-
-
Copy your Workspace ID and either the Primary Key or Secondary Key.
-
Paste the Workspace ID into the Create new connection page.
-
Select Create New.
-
The Send Data page opens. Under the Parameters tab, select the JSON Request Body field, and select the second option.
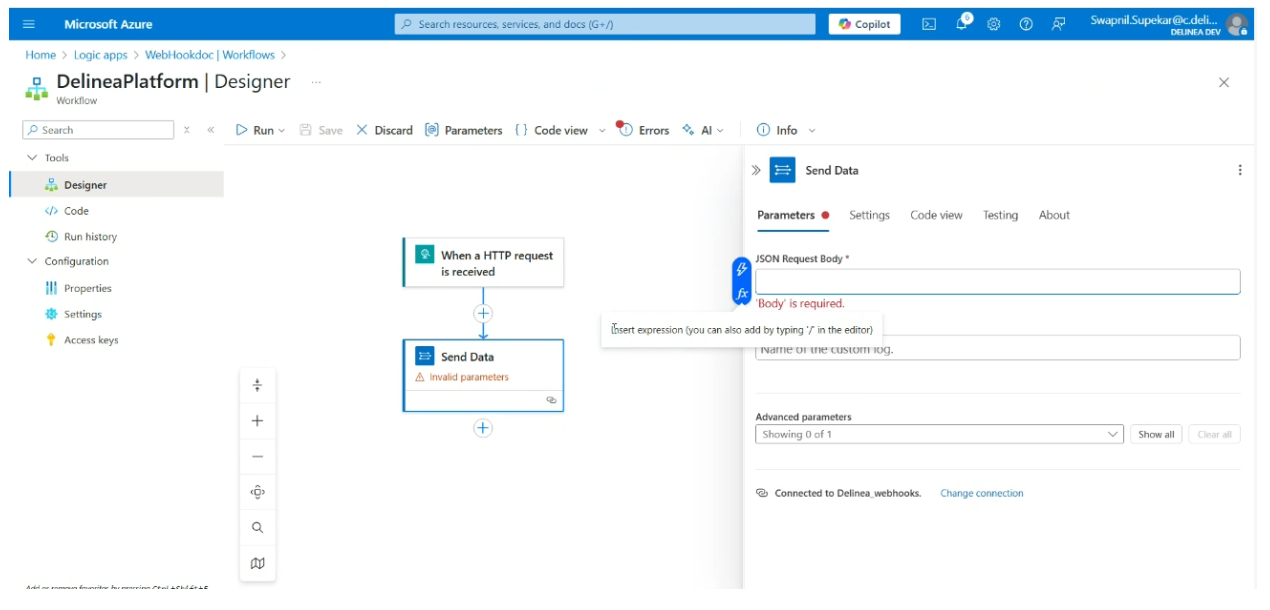
-
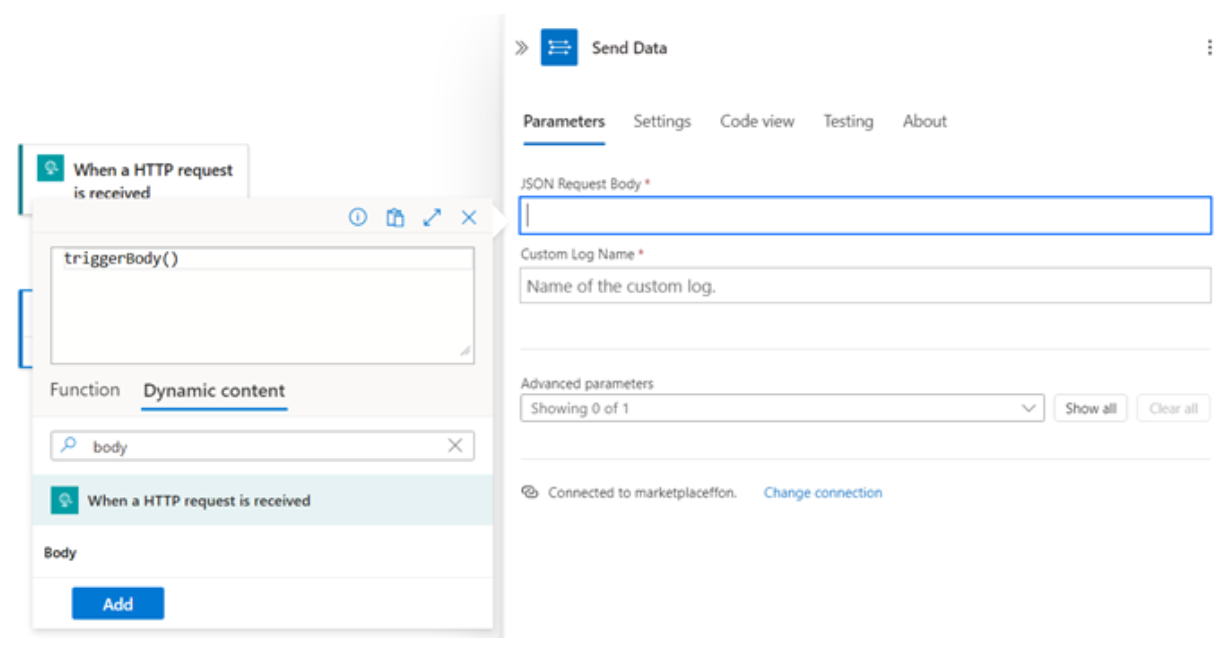
Select the Dynamic content tab and enter 'Body' in the Search field.
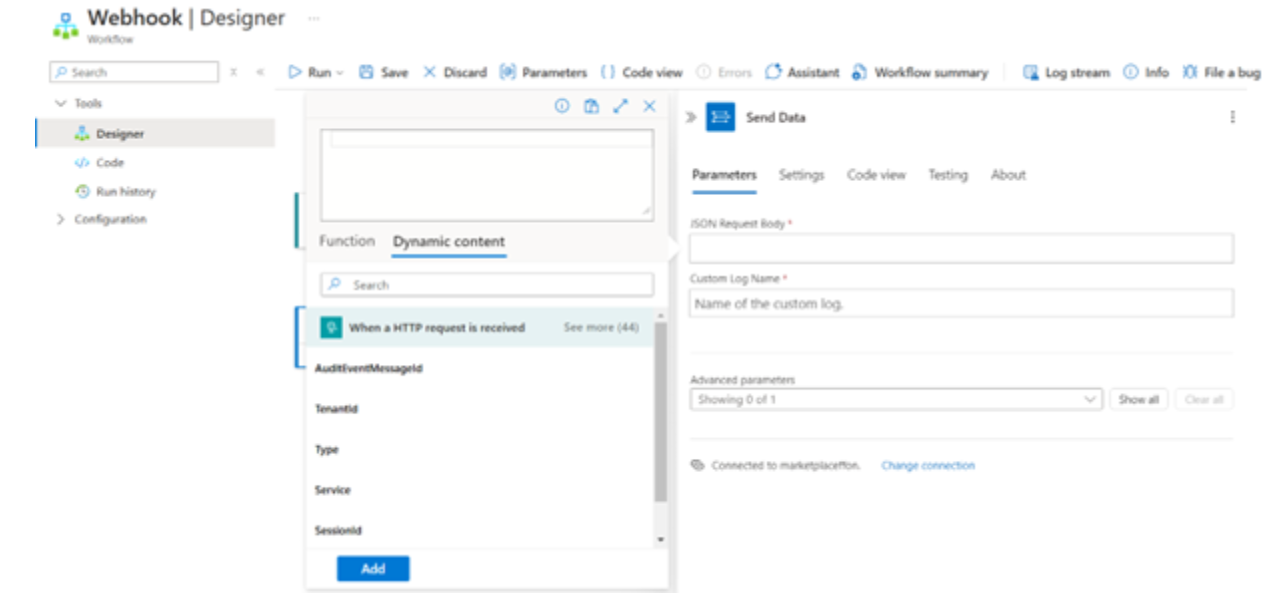
-
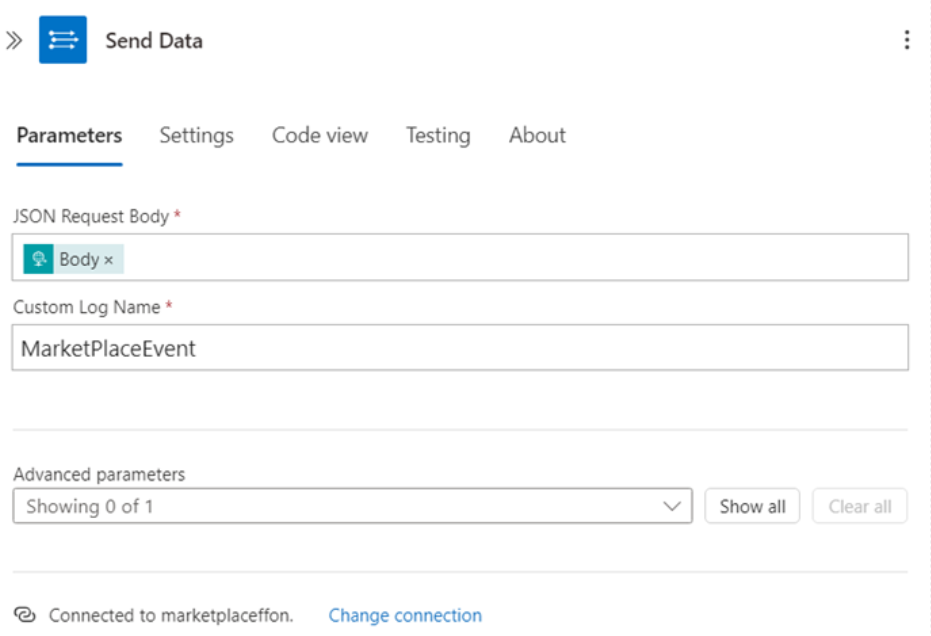
Select the body then select Add.
-
Provide a new name for the Custom Log Name (for example, MarketPlace Event).
-
Select Save.
Option 2: Configuring Microsoft Sentinel Using a DCR
This option uses an Azure logic app to forward Delinea Platform logs to Microsoft Sentinel through the Azure Monitor Logs Ingestion API.
The integration uses the following data flow:
-
A Delinea Platform webhook sends Platform logs to the HTTPS URL of a logic app.
-
The logic app forwards the data to the Logs Ingestion API, which is tied to a data collection rule (DCR) and a data collection endpoint (DCE).
-
The data is stored in a custom table (for example,
DelineaPlatformEvents_CL) in a Log Analytics workspace. The full original JSON is preserved in a column for flexible KQL querying.
For more information about the Logs Ingestion API, see Logs Ingestion API in Azure Monitor. For more information about DCRs, see Data collection rules (DCRs) in Azure Monitor.
Additional Prerequisites
Before beginning, verify the following additional requirements:
-
All Azure resources (workspace, DCE, DCR, and logic app) are deployed in the same Azure region.
-
The administrator has Contributor permissions on the resource group.
-
The administrator has the ability to assign RBAC roles.
To configure the Microsoft Sentinel integration by using a DCR:
-
Identify the Log Analytics workspace.
In the Azure portal, navigate to Microsoft Sentinel > Settings > Workspace. Record the following values:
-
Workspace name
-
Resource group
-
Region
The region is critical — the DCE, DCR, and logic app created in the following steps must all be in the same region as this workspace.
-
-
Create a data collection endpoint (DCE).
In the Azure portal, navigate to Azure Monitor > Data Collection Endpoints > Create.
-
Name: Enter a name for the endpoint, for example
DCE-Delinea. -
Resource group: Select the same resource group as the Sentinel workspace.
-
Region: Select the same region as the workspace.
After the endpoint is created, copy the Logs Ingestion URI from the DCE overview. It follows this format:
https://<dce-name>.<region>-1.ingest.monitor.azure.comFor more information about DCEs, see Data collection endpoints in Azure Monitor.
-
-
Create a custom table and data collection rule (DCR).
Do not create the DCR from Azure Monitor > Data Collection Rules. That path creates a standalone DCR without the required custom table binding, causing ingestion failures.
In the Azure portal, navigate to Log Analytics workspace > Tables > Create > New custom log (DCR based).
In the creation wizard, when prompted for a sample file, upload a JSON file with the following content:
[{"TimeGenerated":"2025-01-01T00:00:00Z","RawData":"{\"event_type\":\"sample\"}"}]The
RawDatavalue must be a JSON-encoded string (with escaped quotes), not a raw JSON object. This ensures Azure creates astringcolumn, which provides reliable storage of the full Delinea Platform payload regardless of schema changes.For Table name, enter a name such as
DelineaPlatformEvents. Azure appends the_CLsuffix automatically, so the resulting table name isDelineaPlatformEvents_CL.Azure automatically creates the following resources when this step is complete:
-
A data collection rule (DCR) linked to this table
-
A stream name for use in the Logs Ingestion API
-
-
Record the DCR values.
In the Azure portal, open the DCR created in the previous step. Navigate to Overview > JSON View and record the following values:
-
immutableId — the DCR identifier, in the format
dcr-xxxxxxxxxxxxxxxx. -
Stream name — for example,
Custom-DelineaPlatformEvents_CL.
The stream name is case-sensitive. Copy it exactly as shown in the JSON view. Use the
immutableIdvalue — not the DCR display name — in the ingestion API URI. -
-
Create a logic app.
In the Azure portal, create a Consumption logic app (recommended).
-
Name: Enter a name, for example
la-delinea-sentinel. -
Region: Select the same region as the workspace.
For more information, see the Azure Logic Apps documentation.
-
-
Enable the managed identity.
In the logic app, navigate to Identity > System-assigned and set the status to On, then select Save.
The managed identity must be enabled before RBAC roles can be assigned to it in the next step.
-
Assign RBAC permissions.
Assign the Monitoring Metrics Publisher role to the logic app's system-assigned managed identity. Scope the assignment to the data collection rule, not to the workspace or resource group.
The role must be scoped to the DCR. This grants the required
Microsoft.Insights/dataCollectionRules/data/writepermission per the Microsoft Logs Ingestion API documentation. -
Configure the logic app workflow.
-
Add the HTTP trigger.
In the logic app designer, add the trigger When an HTTP request is received. Leave the request body JSON schema empty. Save the logic app to generate the public HTTPS URL.
Copy this URL for use when configuring the webhook in step 9.
-
Add the HTTP action for the Logs Ingestion API.
Add an HTTP action with the following configuration:
-
Method: POST
-
URI:
https://<DCE-URI>/dataCollectionRules/<DCR-immutableId>/streams/<StreamName>?api-version=2023-01-01Replace
<DCE-URI>with the Logs Ingestion URI from step 2,<DCR-immutableId>with the immutable ID from step 4, and<StreamName>with the stream name from step 4. -
Headers: Content-Type:
application/json -
Authentication:
Authentication type: Managed Identity
Managed Identity: System-assigned
Audience:https://monitor.azure.com -
Body:
[{"TimeGenerated":"@{utcNow()}","RawData":"@{string(triggerBody())}"}]
The body format wraps the incoming Delinea Platform payload in the schema expected by the DCR. The
string()function serializes the payload as a JSON string, matching theRawDatacolumn type defined in the custom table. UsingutcNow()for the timestamp avoids ingestion failures that can occur when the incoming payload does not include a timestamp field. A successful ingestion returns HTTP status 204 (No Content). -
-
(Optional) Add basic guards:
-
Size check and chunking if Delinea Platform sends large batches.
-
Simple filtering or normalization before forwarding.
-
-
-
Configure the Delinea Platform webhook.
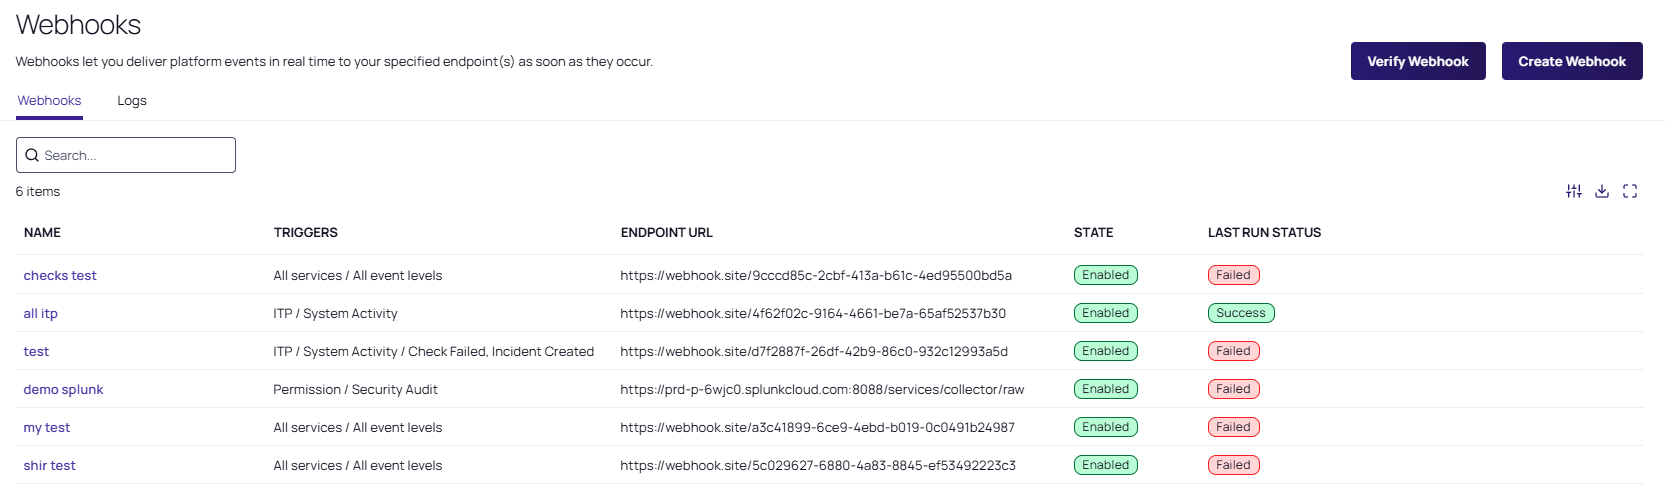
In the Delinea Platform, navigate to Settings > Webhooks and create a new webhook with the following configuration:
-
Endpoint: Paste the logic app trigger URL copied in step 8.
-
Services: Select All (recommended).
-
Levels: Select Info, Warning, and Error.
No custom headers are required. The logic app authenticates to the Logs Ingestion API through its managed identity, not through headers on the inbound webhook request.
-
Option 3: Configuring Microsoft Sentinel Using a DCR ARM Template (Recommended)
This option uses an ARM template to automatically provision all required Azure resources in a single deployment, eliminating the need for manual resource creation. The integration forwards Delinea Platform audit events — such as secret access, user logins, and policy changes — into Microsoft Sentinel in real time, enabling unified security monitoring, anomaly detection, and accelerated incident response.
This method uses the modern Logs Ingestion API with Data Collection Rules (DCR) and managed identity authentication. It does not rely on the deprecated Log Analytics Agent (retired August 2024) or workspace shared keys.
Architecture
The integration uses the following data flow:
-
A privileged action occurs in the Delinea Platform (secret access, login, policy change) and triggers a webhook.
-
The webhook sends a JSON payload via HTTPS POST to the Azure Logic App trigger URL.
-
The Azure Logic App (
la-delinea-sentinel) receives the webhook, authenticates via managed identity, and forwards the data to the Logs Ingestion API. -
The Logs Ingestion API passes the data to the Data Collection Endpoint (
delinea-sentinel-dce), and the Data Collection Rule (delinea-sentinel-dcr) transforms and routes it. -
Events are stored in the
DelineaPlatformEvents_CLcustom log table in Microsoft Sentinel, where they can be queried using KQL.
What the ARM Template Creates
The ARM template automatically provisions the following resources in your Azure subscription:
| Resource | Default name | Purpose |
|---|---|---|
| Custom Log Table | DelineaPlatformEvents_CL
|
Stores Delinea Platform audit events in Log Analytics. |
| Data Collection Endpoint (DCE) | delinea-sentinel-dce
|
HTTPS endpoint that receives log data. |
| Data Collection Rule (DCR) | delinea-sentinel-dcr
|
Routes and transforms data into the custom table. |
| Logic App (with full workflow) | la-delinea-sentinel
|
Receives webhooks from Delinea Platform and forwards to Azure Monitor. |
| RBAC Role Assignment | Monitoring Metrics Publisher | Grants the Logic App permission to write to the DCR. |
Additional Prerequisites
Before beginning, verify the following additional requirements:
-
An active Azure subscription.
-
An existing Log Analytics workspace with Microsoft Sentinel enabled. To find your workspace name and region, go to Microsoft Sentinel > Settings > Workspace settings. The workspace name and region are shown on the Overview page.
-
Contributor permissions on the resource group (required to deploy Azure resources).
-
User Access Administrator or Owner permissions on the resource group (required to assign the Monitoring Metrics Publisher role to the logic app).
Both Contributor and User Access Administrator permissions are required. If you lack User Access Administrator, contact your Azure administrator before starting. Without the role assignment, the Logic App will return 403 errors and no data will reach Sentinel.
To check your permissions, navigate to your resource group in the Azure portal → Access control (IAM) → View my access. If your organization uses PIM (Privileged Identity Management), check Privileged Identity Management → My roles → Azure resources for eligible role activations.
-
Admin access to the Delinea Platform with permission to create webhooks under Settings > Webhooks.
-
The ARM template file,
delinea-sentinel-arm.json— download link provided in Step 1.
Information to Gather Before Starting
Record the following values before starting the deployment:
| Value | Where to find it |
|---|---|
| Log Analytics workspace name | Azure Portal → Microsoft Sentinel → Settings → Workspace settings → Overview |
| Workspace region | Same location as above (for example, East US, West Europe) |
| Resource group name | Azure Portal → Resource groups |
All Azure resources must be deployed in the same region as the Log Analytics workspace. A region mismatch will cause ingestion failures.
Step 1: Download and Deploy the ARM Template
-
Download the ARM template file: delinea-sentinel-arm.json.
Save the file to a location you can easily find, such as your Desktop or Downloads folder. Verify the file has the
.jsonextension — if your operating system appended.txt, rename the file to remove it. Do not modify the contents of the file. -
Go to portal.azure.com and sign in with an account that has Contributor and User Access Administrator permissions.
-
In the search bar, type Deploy a custom template and select it from the results under Services.
-
Select Build your own template in the editor.
-
Select Load file and upload
delinea-sentinel-arm.json. Do not modify any of the content in the editor. -
Select Save. The parameter form opens.
-
Complete the parameter form as follows:
Parameter Value Notes Subscription Your Azure subscription Select from the dropdown. Resource group Your target resource group Select existing or create new. Region Must match your workspace region exactly Auto-populated from the resource group. Verify it matches (for example, East US or West Europe). Workspace Name Your Log Analytics workspace name Must be the exact name, case-sensitive. Location Leave as default Pre-filled with [resourceGroup().location]. Do not change.Dce Name delinea-sentinel-dceRename only if required by your naming convention. Dcr Name delinea-sentinel-dcrRename only if required by your naming convention. Logic App Name la-delinea-sentinelRename only if required by your naming convention. Table Name DelineaPlatformEvents_CLMust end in _CL. Do not change unless you have a specific reason.The Region parameter must match your Log Analytics workspace region exactly. The workspace can be in a different resource group, but the region must be identical. A mismatch will cause data ingestion to fail silently.
To verify your workspace region, open a new browser tab, go to the Azure portal, search for Log Analytics workspaces, select your workspace, and check the Location field on the Overview page.
-
Select Review + create. Azure validates the template.
-
If validation passes, select Create. Deployment takes approximately 2–3 minutes.
-
If validation fails with an Authorization error, see the note below.
If validation fails with an Authorization error, your account lacks permission to create role assignments, which blocks the entire deployment. You have three options: (A) activate your PIM role for User Access Administrator and retry; (B) ask your Azure admin to deploy the template; or (C) remove the
Microsoft.Authorization/roleAssignmentsblock from the template, deploy, and complete Step 3 manually. -
Step 2: Retrieve the Logic App Trigger URL
The ARM template fully pre-configures both the Logic App trigger and the HTTP action. No manual workflow configuration is needed.
-
Select Go to resource group on the deployment success page.
-
Select Deployments in the left menu.
-
Select the latest deployment, then select the Outputs tab.
-
Copy the value of logicAppTriggerUrl. This is the URL you will enter in the Delinea Platform webhook in Step 4.
The URL follows this format:
https://prod-xx.eastus.logic.azure.com:443/workflows/xxxx.../triggers/...
If the Outputs tab is empty, navigate to the Azure portal → search for Logic Apps → open la-delinea-sentinel → select Logic app designer in the left menu → select the When an HTTP request is received trigger block → copy the HTTP URL shown in the right panel.
Step 3: Verify the Role Assignment
The ARM template automatically assigns the Monitoring Metrics Publisher role to the Logic App. Verify this was completed successfully:
-
In the Azure portal, search for Data Collection Rules and open
delinea-sentinel-dcr. -
Select Access control (IAM) in the left menu, then select the Role assignments tab.
-
Search for
la-delinea-sentinel.-
If Monitoring Metrics Publisher is listed, proceed to Step 4.
-
If it is not listed, complete the manual role assignment below.
-
If the role assignment is missing, you must complete it manually. Without this role, the Logic App will return 403 Forbidden errors when forwarding data and no logs will reach Sentinel.
Manual role assignment (only if missing):
-
Open
delinea-sentinel-dcrand select Access control (IAM). -
Select + Add > Add role assignment.
-
Search for and select Monitoring Metrics Publisher.
-
Select Next > + Select members, search for
la-delinea-sentinel, and select it. -
Select Review + assign.
Wait 2–3 minutes before retesting. Role assignments take time to propagate in Azure — retesting immediately may return a 403 even if the assignment was successful.
Step 4: Configure the Delinea Platform Webhook
In the Delinea Platform, navigate to Settings > Webhooks and create a new webhook with the following configuration:
-
Name: Microsoft Sentinel
-
Endpoint URL: Paste the logic app trigger URL copied in Step 2.
-
Webhook State: Enabled
-
Services: All (recommended)
-
Levels: Info, Warning, and Error
No custom headers are required. The Logic App authenticates to the Logs Ingestion API through its system-assigned managed identity, not through headers on the inbound webhook request.
Troubleshooting
Use the following guidance to resolve common issues that can occur when deploying the ARM template.
| Problem | Cause | Resolution |
|---|---|---|
| Validation fails with an Authorization error | Account lacks role assignment permissions | Activate PIM role (User Access Administrator), or ask your Azure admin to deploy, or remove the role assignment block and complete Step 3 manually. |
| HTTP action returns 403 Forbidden | Monitoring Metrics Publisher role not assigned | Complete the role assignment in Step 3. Verify via DCR > Access control (IAM) > Role assignments. |
| HTTP action returns 400 InvalidStream | Stream name mismatch in the Logic App URI | Open DCR → JSON View → copy the exact stream name from streamDeclarations → update the Logic App HTTP action URI. |
| No KQL results after 30 minutes | First-time ingestion delay or time range too narrow | Confirm HTTP action shows 204. Set KQL time range to Last 7 days. If 403, complete Step 3. |
| KQL results show null values in RawData | Test Webhook button was used | Trigger a real event in Delinea Platform (open a Secret, log in, and so on). |
| Outputs tab is empty after deployment | Deployment partial failure | Get the trigger URL directly from the Logic App designer. See Step 2 alternative. |
| Logic App trigger URL stops working | URL signature (sig=) has expired |
Open Logic App designer → Save → copy new URL → update Delinea Platform webhook Endpoint URL. |
Validating the DCR Integration
After completing the configuration for Option 2 or Option 3, verify that data is flowing from the Delinea Platform through the logic app to Sentinel.
-
In the Delinea Platform, open a real Secret to generate a properly populated audit event. Do not use the Test Webhook button — it sends an empty payload, which results in null values in KQL and will appear as if the integration is not working.
-
In the Azure portal, open the logic app and check the Run history. Confirm that a trigger was fired and that the HTTP action returned a 204 status code.
-
In Microsoft Sentinel, navigate to Logs and run the following KQL query:
DelineaPlatformEvents_CL
| order by TimeGenerated desc
| take 20 -
Verify that rows appear with populated
TimeGeneratedandRawDatacolumns.
To parse individual fields from the stored payload, use parse_json() in KQL queries. For example:
DelineaPlatformEvents_CL
| extend EventData = parse_json(RawData)
| extend
    EventType = tostring(EventData.event_type),
    Service   = tostring(EventData.service),
    Level     = tostring(EventData.level),
    User      = tostring(EventData.details.user),
    SecretId  = tostring(EventData.details.secret_id)
| project TimeGenerated, EventType, Service, Level, User, SecretId
| order by TimeGenerated desc
Step 2: Configuring the Delinea Platform
To configure the Delinea Platform for the integration with Microsoft Sentinel, you must create a webhook in the platform.
-
Log in to the Delinea Platform.
-
From the left navigation menu, navigate to Settings > Webhooks.
-
On the Webhooks page, select Create Webhook.
-
Complete the following webhook configuration fields:
-
Name: A name for the webhook.
-
Endpoint URL: Set to the Logic App trigger URL.
-
Description: Optional (for example, "Forwards logs to Microsoft Sentinel").
-
Webhook State: Select Enabled.
-
Triggers: Select the services and event levels (Info, Warning, Error) to send to Microsoft Sentinel.
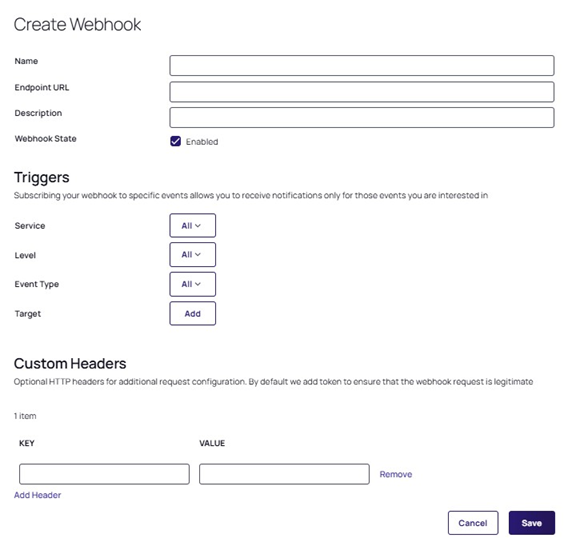
If Delinea Platform provides a sample schema, you can still forward it as-is; the Logic App will embed it into the
RawDatacolumn. -
-
Select Save to complete the webhook configuration.
Validating Event Data
-
In the Delinea Platform, navigate to Settings > General setup > Webhooks.
-
Select the Microsoft Sentinel webhook.
-
In the panel on the right, select View webhook logs.
-
Select a log entry and in the panel on the right, select View Payload.
Example Delinea Platform Webhook Payload
Copy{
"event_type": "SecretAccessed",
"service": "Secret Management",
"level": "info",
"details": {
"user": "frank",
"secret_id": "A1B2C3",
"timestamp": "2025-09-16T16:55:00Z"
}
}
Verification
Verify that the Delinea Platform events are being collected for Microsoft Sentinel.
-
Log in to the Delinea Platform and open a real Secret to generate a properly populated audit event. Do not use the Test Webhook button. It sends an empty payload, which results in null values in KQL and will appear as if the integration is not working.
-
In Azure Logic Apps, open your logic app.
-
In the Logic App run history, confirm that a trigger was fired and a POST request to Logs Ingestion succeeded (a 2xx status code).
-
Go to the Sentinel dashboard in the Microsoft Sentinel Portal.
-
From the left navigation menu, select Logs.
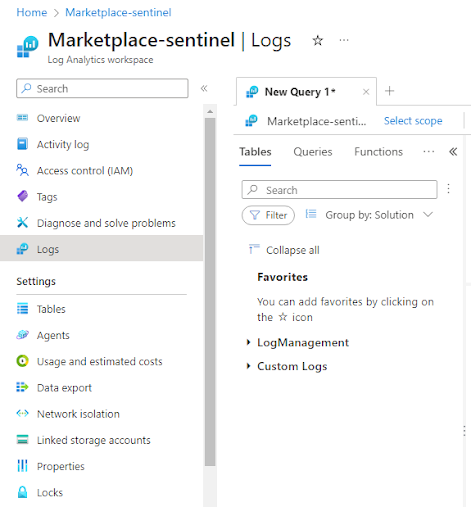
-
In the query editor, enter the following KQL query:
DelineaPlatformEvents_CL
| order by TimeGenerated desc
| take 20 -
Verify that the log is displayed.
The
TimeGeneratedandRawDatacolumns should be populated.