Using Alerts
Alerts identify any deviations from expected configuration or a baseline of your Delinea Platform tenant. The mechanism that identifies alerts runs continuously in your environment. Alerts help administrators and other staff members learn to recognize trends and better respond to security threats.
Based on the data available in activities like IP address and user agent, the Platform can determine anomalous locations or user agents. By tracking those activities over time and correlating them with user historical data and actions, the Platform can determine a baseline of user activity for their common locations, IP addresses, browsers used, and so on.
The data can also be used to identify authentication attack attempts like brute force and MFA bombing. While analytics generate alerts to highlight those findings each time something is detected, the end result is user risk. The risk assessment reflects the sensitivity of the account based on those findings.
Analytics Findings and Risk
Analytics generate alerts based on different rules, the deviation from those rules, or any risk detected on the account. For example, an alert could be generated when an attempt is made to guess the account password.
Based on the alerts that are triggered for each user, the Delinea Platform calculates the risk of the Platform account. This risk is taken into account only if the alert is unresolved. The analytics feature calculates a risk score for each user: low, medium, high, or N/A if no alerts where found for the user.
Risk Scores
Risk is shown in the Risk Score column in the Users table. (From the left navigation, select Access > Users.) For more information about the Users table, see User Accounts and Groups.
You can select a user from the list to view a details page, then select the User risk tab. This tab shows the user's risk score and the alerts that contributed to the score. If the risk exists and has alerts, you can review how each alert contributes to the user risk from this page to understand why it was triggered.
Viewing Alerts
Alerts are available as part of the Threat Center.
From the left navigation, select Threat Center > Alerts.
The Alerts page is displayed. The Alerts table shows all the alerts that your account has permissions to view. By default, the table displays all alerts that were created in the last 30 days that have not been marked as resolved.
Customizing the Display
You can control which columns are presented in the Alerts table using the Displayed Columns icon (![]() ).
).
Use the Search box to locate a specific alert by name.
Use the cards at the top of the table to filter the data displayed in the table. Each card provides a dropdown list of parameters defined for that column. Select values in each dropdown to restrict the type of data displayed for that column.
To find only the alerts related to analytics, filter the table to only show Apps in the Delinea Platform.
The following table describes the columns in the Alerts table.
| Column | Description |
|---|---|
| Alert Name | A descriptive title for the alert. |
| Affected entity | The entity that was affected by this alert |
| Affected entity type | The type of entity related to the alert |
| Source apps | The application this alert relates to, usually the same app as of the affected entity |
| MITRE | The MITRE tactics the alert relates to |
| Category | The category of the alert as assigned by Delinea |
| Compliance | Any associated compliance standards. Supported standards include: SOC 2, ISO 27001, CSA 4, CSA 3, and CIS V8. |
| Created date | The time when this alert was created |
| Last Detected At | The time elapsed since the last alert was detected |
| Severity | The severity assigned to this detection: low, medium, or high |
| Resolution | Status of the alert: resolved or unresolved |
Types of Alerts
The following table explains the types of alerts.
| Alert Name | Description | Logic |
|---|---|---|
|
Login on weekend |
User login during a weekend |
Trigger an alert if a user logs in on Sunday or Saturday. Filter out users who are active on two or more consecutive weekends. |
|
User performed an activity from an abnormal location |
User performed an activity from a location where they are not normally found |
Based on the session IP, compare the session location to the user's previous locations (at least 10 days of baseline required) and alert if the location is new. Ignores IPs with unknown locations. |
|
Irregular session |
The user sessions started before or after the user's usual activity time, determined by the user timeline |
Baseline data is collected for at least 14 days of activities. Based on this baseline, determine the user's usual start time and end time, as one standard deviation from start and end time. Each session occurring outside of those thresholds triggers an alert. |
|
Abnormal spike in users activity |
The user performed more than five times their normal activities |
Determine whether the baseline of at least 14 days of Platform usage exists for the user. If the baseline exists, calculate a baseline of activities, excluding some like login/MFA and secret view.
Trigger an alert if the user's non-excluded Platform actions exceed five times the number of average activities. |
|
Brute force |
Attempt was made to brute force an account |
Detect any of these events:
|
|
Account under MFA bombing attack |
Detects MFA bombing events and repeated attempts to access an account that requires MFA authentication |
Detect MFA bombing by performing the following:
|
| Inactive user performed an action | Triggered if a dormant account for at least 90 days performed an activity | Per each non enabled account, we search for actions that occurred after a period of 90 days or more of inactivity, meaning in this time period, the system did not record any activity for the user. |
Viewing Alert Details
Click the Alert Name to view its details panel.
Details may differ due to updates.
Alert Properties
| Alert Property | Description |
|---|---|
| Resolution | Status of the alert: resolved or unresolved |
| Affected entity | The entity that was affected by this alert |
| Actor | The entity/IP that performed the action in the alert |
| Created at | The time when this alert was created |
| Updated at | The last time the system scanned the issue |
| Compliance | The compliance standards |
| MITRE | The MITRE tactics the alert relates to |
| Source app | The application this alert relates to, usually the same app as of the affected entity |
| Severity | The severity assigned to this detection: low, medium, or high |
| Category | The category of the alert as assigned by Delinea |
In addition to the basic descriptions of alert properties, additional controls are available using the tabs in the Alerts page.
General Tab
Provides details about what was detected, as well as general alert properties. For a description of the columns in this tab, see Inventory Filter Properties.
Entities Tab
Displays the entities that are affected or related to the alert or the actor who caused the issue. Alerts can be connected to the following types of entities:
-
Affected: Who was affected by the detection
-
Actor: The person or IP who performed the action detected in the alert
-
Related: Anything or anyone that was related to the alert but not affected directly
Evidence Tab
Displays static information that can help you understand what happened and what data the Delinea Platform had at the moment the alert was detected; for example, user IP information, session details, or a map showing the user baseline locations with the detected suspicious location. The different types of evidence give details about the alert and the information used to detect it.
Evidence for alerts can include the following types of contexts:
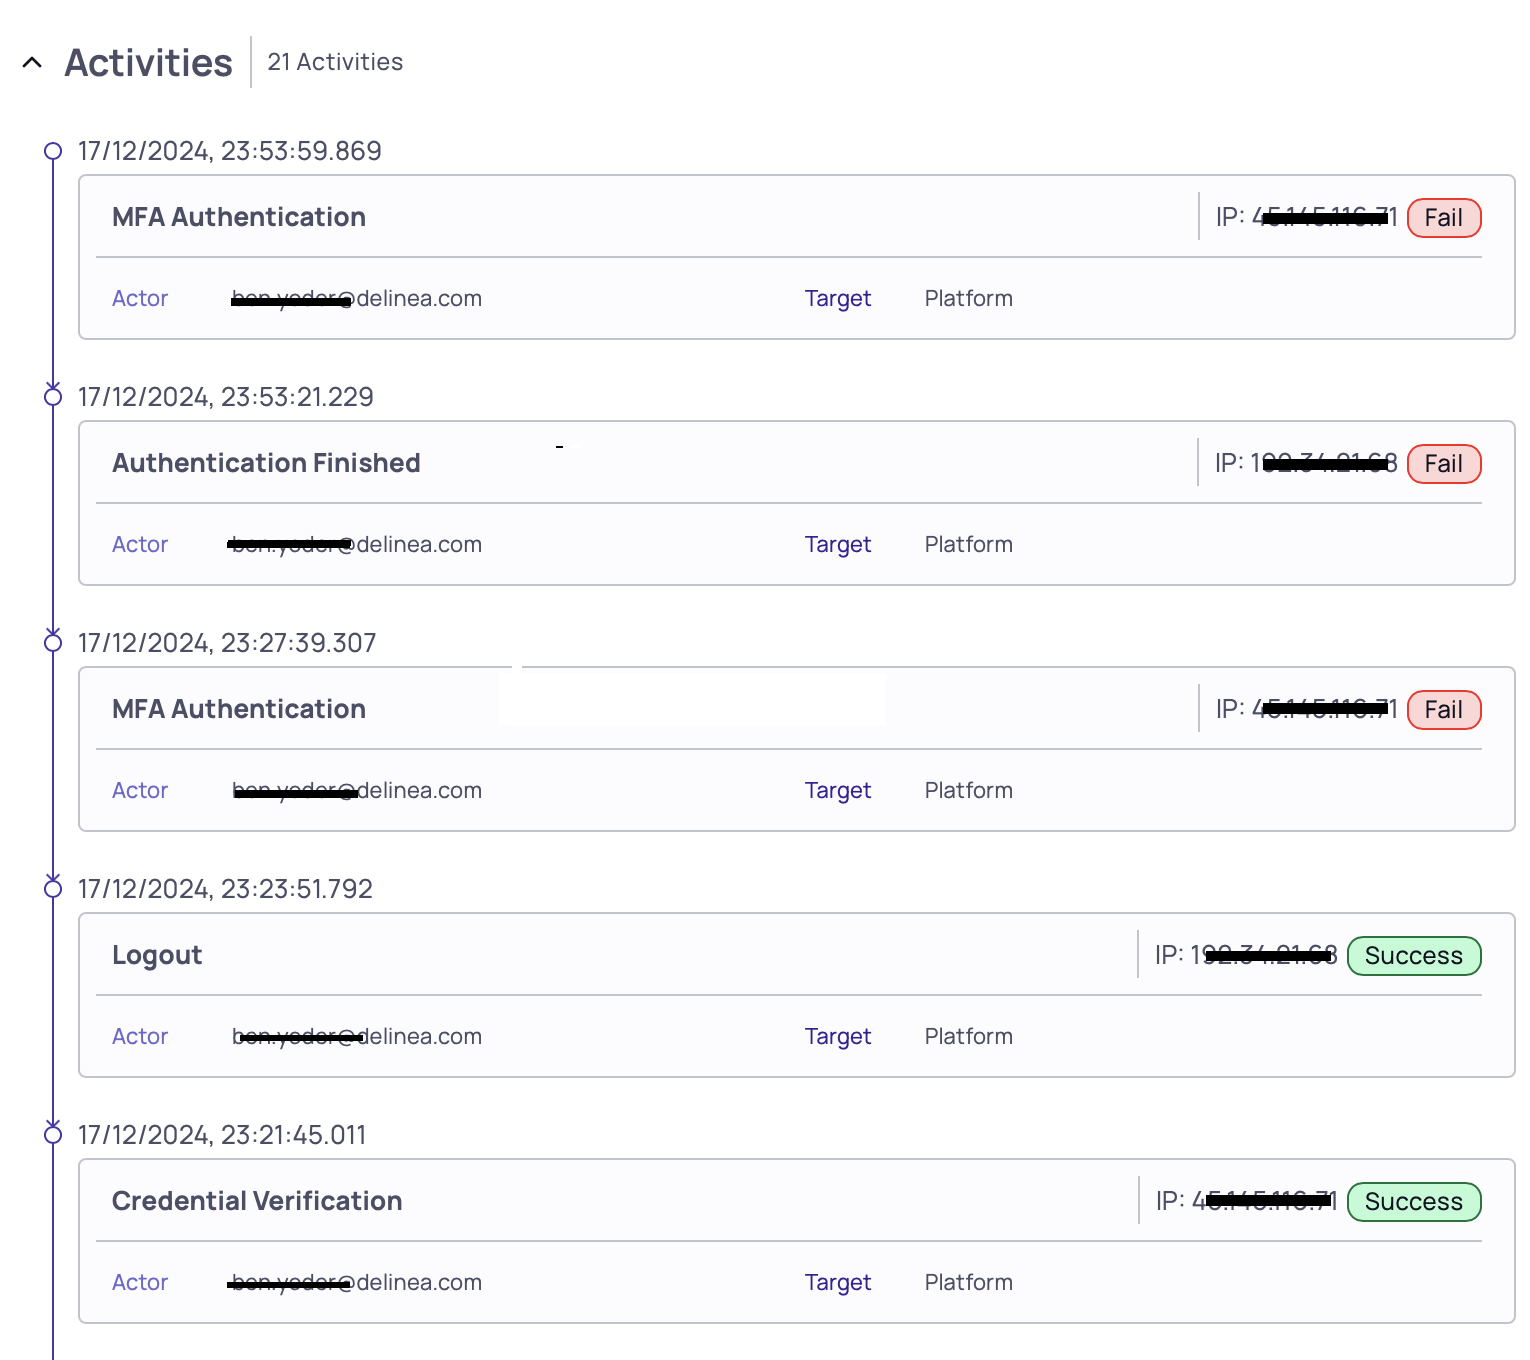
-
Related activities: Timeline of the actions/activities that were taken and found to be either the root cause of the alert or related to the alert. Each line represent an action taken by a user in the system.
-
IPs: Aggregated list of IPs that were included in the alert. For each IP, extra information is displayed, such as the location.
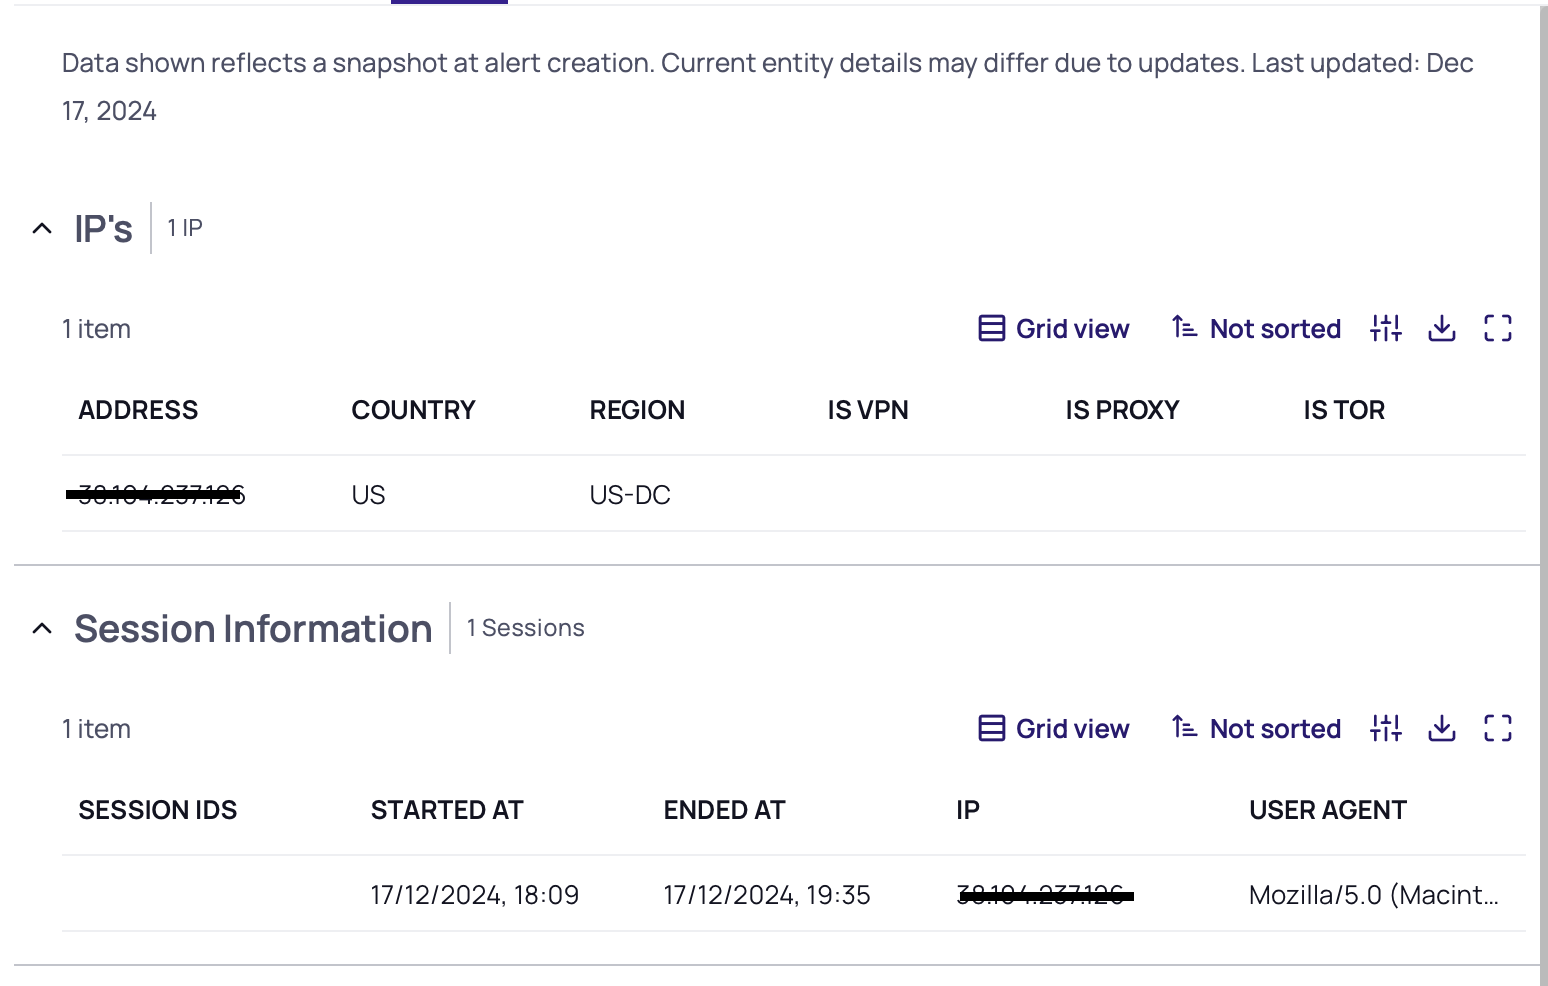
-
Sessions: List of sessions related to the alert. The list can be a single session or multiple sessions. Each has a start and end time and represents the timeframe when the user was active in the system. Each session can come from a different IP and user-agent. This data will be shown in this context.
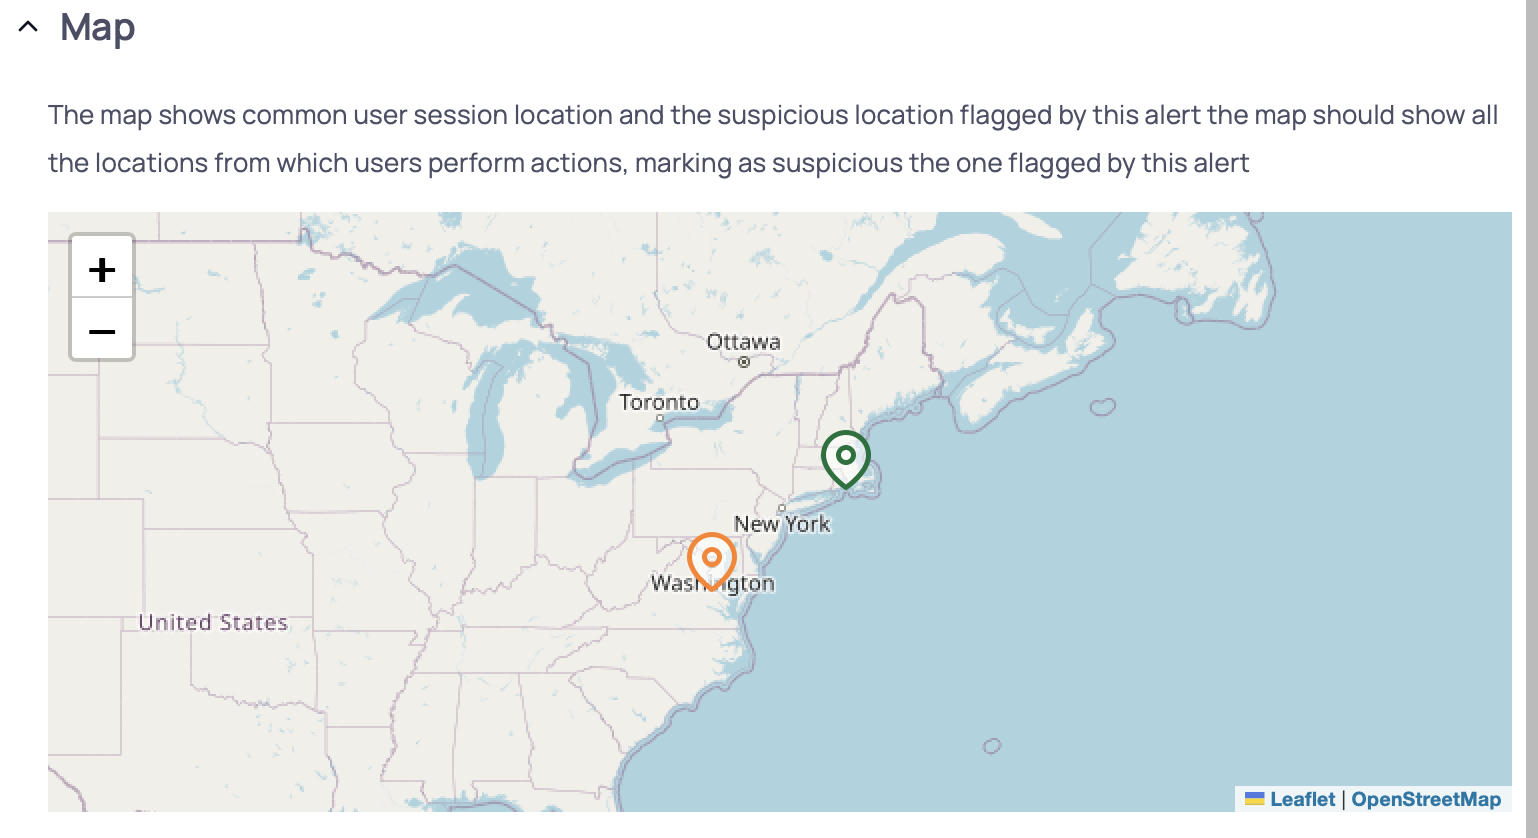
-
Map: User locations. The map can show common locations and suspicious locations. Common locations are marked in green, and suspicious locations are marked in orange.
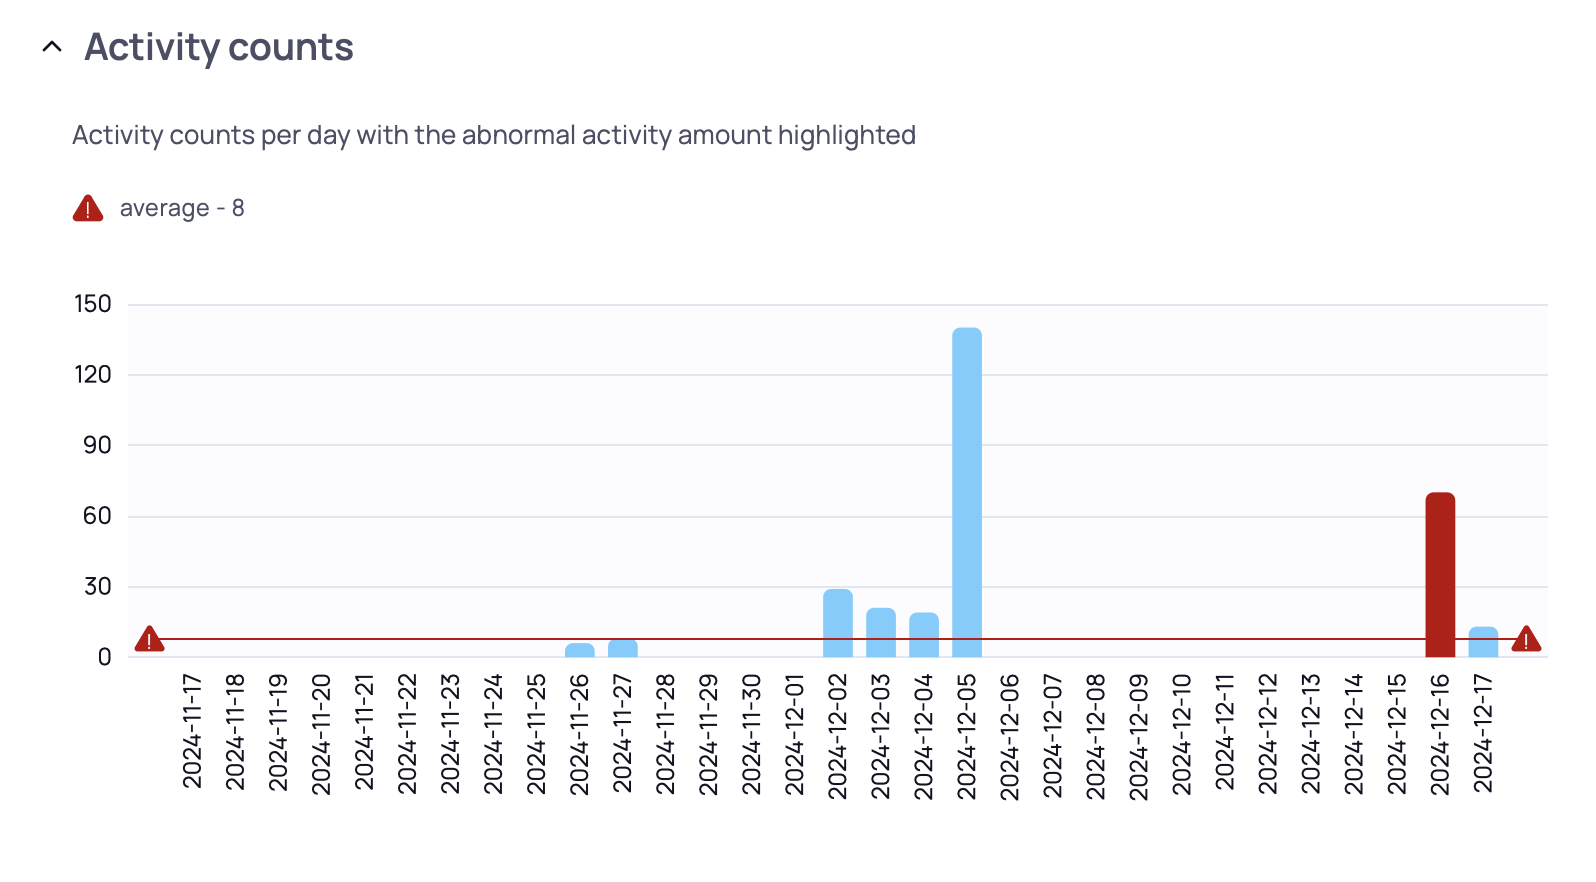
-
Burst of activities: Bar chart showing user activities over time. For example, this can show a historical baseline of the user's administrative activities over a period of a month and highlight (in red) the anomalous day.
-
Heatmap: Chart that usually shows users sessions over a period of 30 days. This chart is used to show when the user is active, the session duration, and if available, lower and upper thresholds for the user activity time.
-
Suspicious activities breakdown: Chart that is part of the
Abnormal spike in users activityalert. Shows all activities, grouped by type, that were performed by the user on the day the Delinea Platform detected a spike in activity.
Resolving an Alert
Each new alert is unresolved by default. An alert is marked as resolved and moved to a resolved state if:
-
The issue can no longer be detected by the rule.
-
The detection is based on activities, and 30 days have passed since the original detection. Alerts automatically resolve after 30 days.
-
After reviewing the alert, you determine it is not of concern, and click Mark as False Positive.