Reviewing Audit Logs
Audit logs are used to communicate monitored activity occurring across the platform.
Accessing Audit Logs
To access Audit logs, follow these steps:
- Go to the Delinea Platform home page.
- From the left panel, click Insights, then click Audit logs.
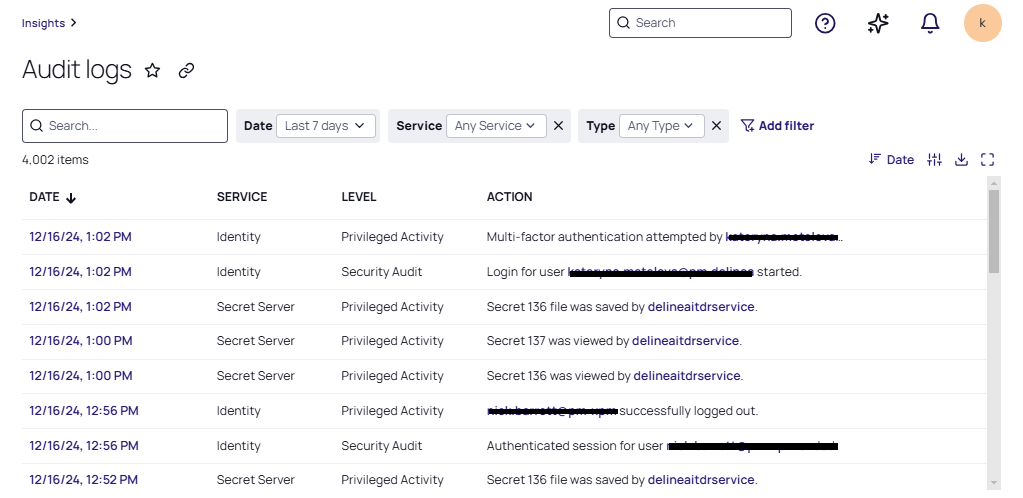
Viewing The Audit Log
Events that your account has permissions to view are presented in the Audit logs table. Click any row in the table to view its Event details in the review panel.
The Action column of the log captures user behavior and may include hyperlinks to additional properties.
Customizing the Audit Log Table
The columns in the Audit Log table present data associated with the event. Some columns can be sorted in either ascending or descending order. You can customize which columns are presented using the Displayed Columns icon (![]() ).
).
The columns are:
| Column | Definition |
|---|---|
| Date | The time stamp when the audit event occurred |
| Service |
For a description of the services available for monitoring, see Selecting Audit Levels for Display. |
| Level | The classification of the audit event (Security Audit or Privilege Activity) For a description of the levels available for monitoring, see Selecting Audit Levels for Display. |
| Event Type | The category of action performed, such as Secret View, Secret Checkout, or Alert Created. |
| Action |
|
| Initiated By | The username of the platform user who triggered the audit event |
| Target | The specific entity affected by the audit event, such as a secret |
| Source | The specific source affected by the audit event (e.g., machine host name, IP address, etc.) |
| Field Changes | The changes made to any field for each action logged |
Filtering Events
By default, the last 7 days of events are shown. Other options include 24 hours, 48 hours, 3 days, 7 days, 30 days, or 60 days. To change the time period, use the dropdown list in the Date filter card.
To further narrow down the list of events, click Add filter. Select the desired filter criteria. Its associated card appears at the top of the table. Use the card's dropdown list to set the desired value for filtering. For more information, see Filtering in List Pages.
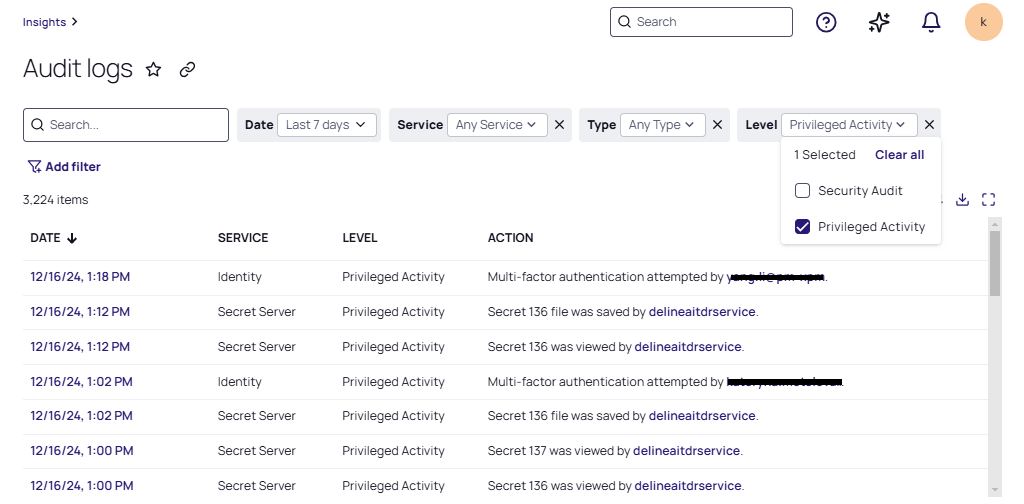
Selecting Audit Levels for Display
The event logs are divided into two categories:
-
Security Audit logs include critical actions, such as configuration changes in Delinea services.
-
Privileged Activity logs include actions that are important, but not critical, such as creating secrets, viewing passwords, or launching an elevated process on an endpoint.
To choose which category to display, click Add filter and select the Level filter criteria. Use the Level dropdown list to indicate the categories to display. (For more information about filtering, see Filtering in List Pages.)
For a detailed list of the Services that support these levels, see the following:
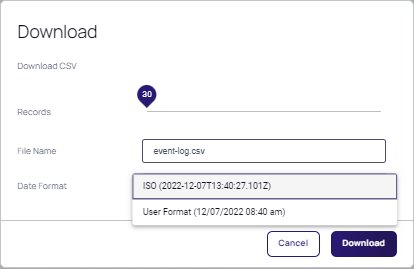
Downloading Event Log Data
The data from the event log can be downloaded as a CSV file.
-
Click the Download icon in the top control bar.
-
In the Download dialog, specify a File Name.
-
In Data Format, choose a User Format or ISO format as the format for the CSV file label.
-
Click Download.