Viewing Alerts
Alerts are available as part of the Threat Center.
From the left navigation, select Threat Center > Alerts.
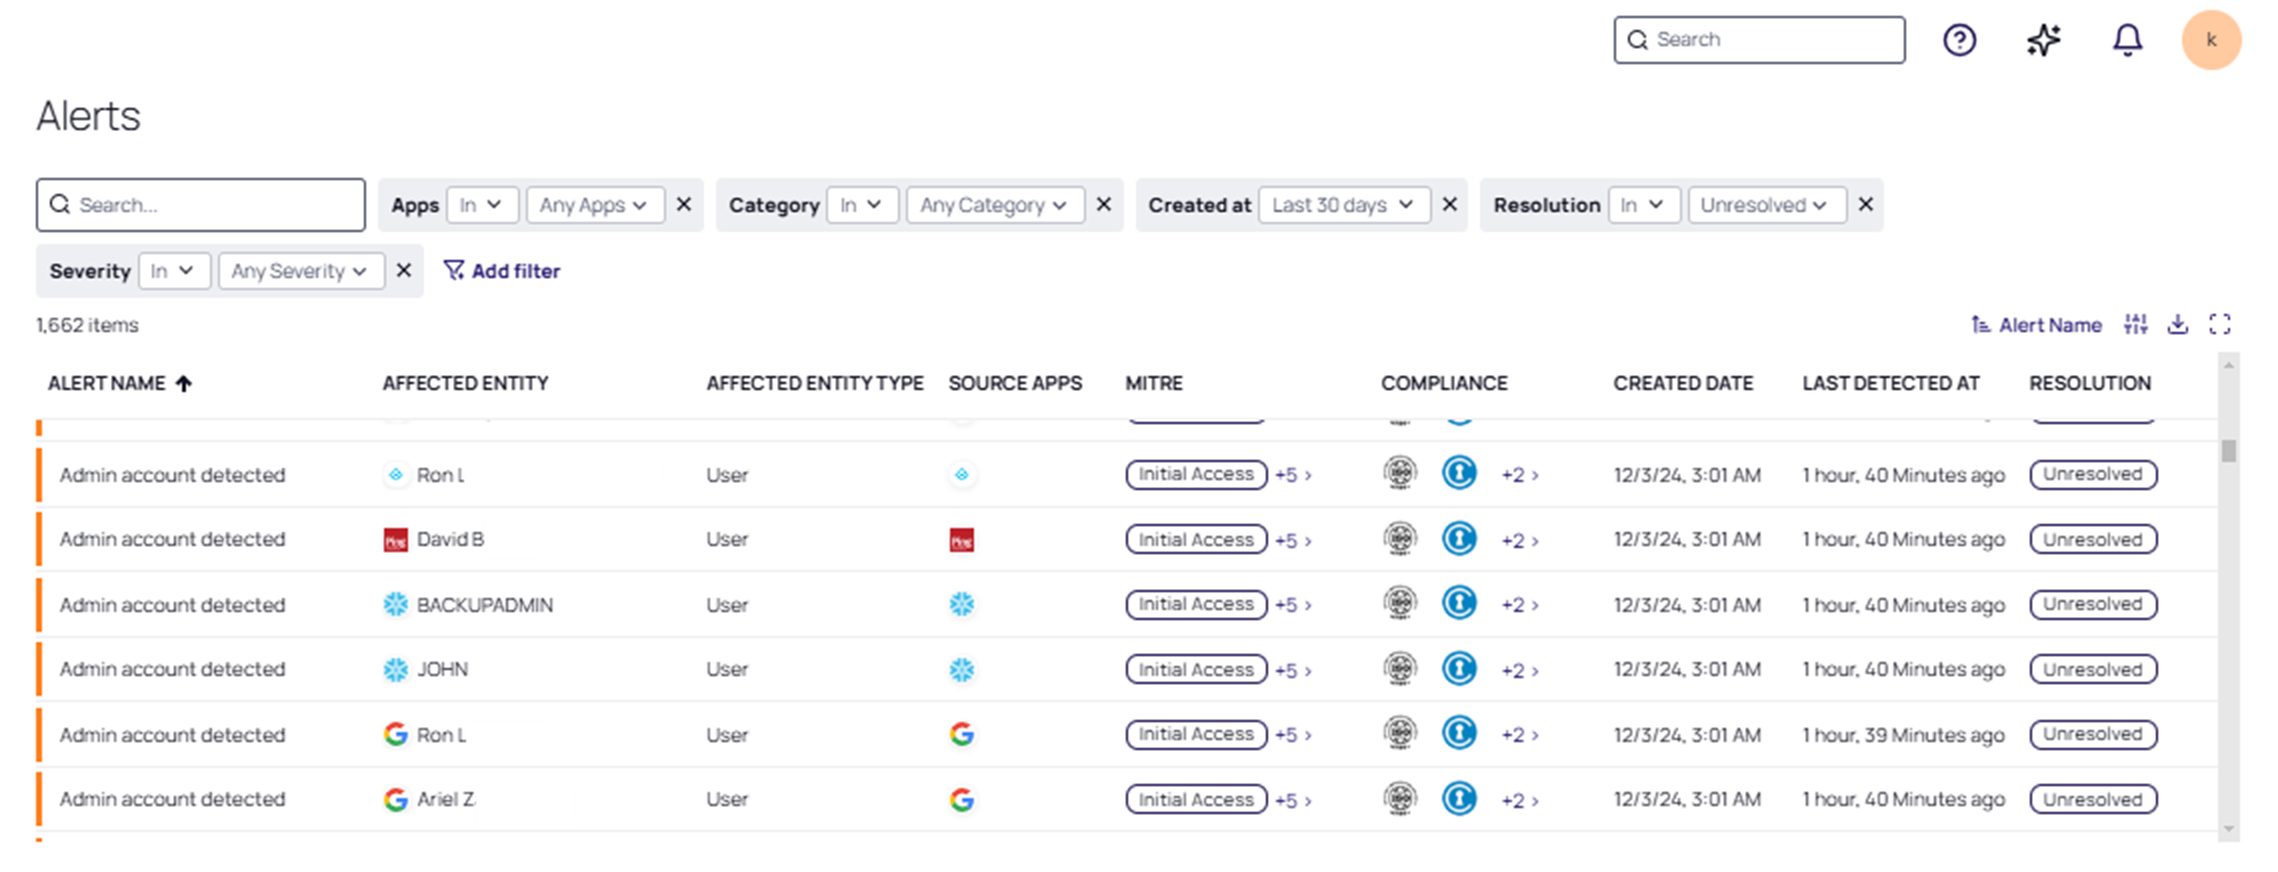
The Alerts page is displayed. The Alerts table shows all the alerts that your account has permissions to view. By default, the table displays all alerts that were created in the last 30 days that have not been marked as resolved.
Customizing the Display
You can control which columns are presented in the Alerts table using the Displayed Columns icon (![]() ).
).
Use the Search box to locate a specific alert by name.
Use the cards at the top of the table to filter the data displayed in the table. Each card provides a dropdown list of parameters defined for that column. Select values in each dropdown to restrict the type of data displayed for that column. For more information, see Filtering in List Pages.
To find only the alerts related to analytics, filter the table to only show Apps in the Delinea Platform.
The following table describes the columns in the Alerts table.
| Column | Description |
|---|---|
| Alert Name | A descriptive title for the alert. |
| Affected entity | The entity that was affected by this alert |
| Affected entity type | The type of entity related to the alert |
| Source Apps | The application this alert relates to, usually the same app as of the affected entity |
| MITRE | The MITRE tactics the alert relates to |
| Category | The category of the alert as assigned by Delinea |
| Compliance | Any associated compliance standards. Supported standards include: SOC 2, ISO 27001, CSA 4, CSA 3, and CIS V8. |
| Created date | The time when this alert was created |
| Last Detected At | The time elapsed since the last alert was detected |
| Severity | The severity assigned to this detection: low, medium, or high |
| Resolution | Status of the alert: resolved or unresolved |