Configuring Report Services and Deploying Your Reports
You use the configuration wizard to both set up a new report services deployment or reconfigure an existing one.
If you want to just redeploy your reports, see Re-deploying SQL Server reports to SSRS.
Configuring a SQL Server Report Services Deployment
Follow these instructions if you're creating a new report services deployment using SQL Server or reconfiguring an existing SQL Server report services deployment.
To configure report services with a SQL Server database:
-
If you need to start the Delinea Report Services configuration wizard, go to the Start menu > All Programs > Centrify Server Suite 2021.1 > Report Services, and choose Configuration Wizard.
If you’re continuing from the Delinea Management Services installer, the installer started the configuration wizard for you.
-
On the Welcome screen, click Next to continue.
-
If you have already set up report services, the Reconfiguring Report Services screen displays. Select Reconfigure and click Next to continue.
-
On the Database Type screen, select SQL Server and click Next to continue.
-
Configure the SQL Server database connection:
-
Specify the SQL Server instance name.
Either specify a new SQL Server instance name, or select an existing SQL Server instance name. (The default instance name is CENTRIFYSUITE.)
The SQL Server instance name must be 16 characters or less, the name cannot begin with an underscore (_) or dollar sign ($), and the instance name cannot contain any of the following special characters: a blank space, backslash (\), comma (,), colon (:), semi-colon (;), single quotation mark ('), ampersand (&), hyphen (-), number sign (#), or at sign (@).
If you select an existing SQL Server instance, be aware that the SQL Server browser service must be running if SQL Server is a named instance or using dynamic ports. If for some reason the SQL Server service can’t be started, you need to provide the SQL Server instance name and port number in order to connect to the database successfully. For additional details, see https://technet.microsoft.com/en-us/library/ms181087(v=sql.105).aspx.
Delinea recommends that you use a new SQL Server instance, if possible. For more information, see Impact of using a new or existing SQL Server instance.
-
The default database name is Report. You can change this, if desired.
The SQL Server database name must be 16 characters or less, the name cannot contain any of the following special characters: backslash (\), forward slash (/), colon (:), asterisk (*), question mark (?), double quotes (“), less-than sign (<), greater-than sign (>), pipe (|), comma (,) or single quotation mark (').
-
Click Next to continue.
-
If you selected to install a new SQL Server instance, click Browse to navigate to and specify the location of the SQL server installation executable (*.exe file).
The installer program installs SQL Server 2008 R2 Express with Advanced Services.
You can download the SQL Server Express with Advanced Services package directly from Delinea, for your convenience. Or, download the package from Microsoft.
Please ensure to download the file name SQLEXPRADV_x64_ENU.exe (1,008.6 MB in size) as this is the one containing the 64-bit edition of SQL 2008 R2 with the necessary additional components to support Delinea Reporting Services.
-
Click Next to continue.
-
-
Deploy the reports:
-
In the SQL Server Reporting Services screen, specify whether to deploy the Server Suite reports (or not).
If you plan to use a reporting solution other than Microsoft SQL Server Reporting Services, do not deploy the reports.
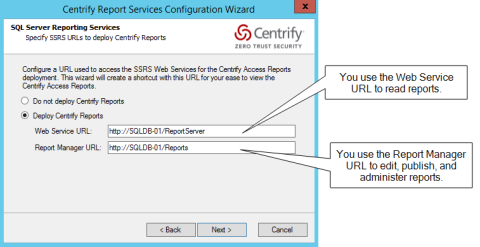
This screen also lists the URLs for the Reporting Web Service and Report Manager. You’ll use these URLs later to access to the reports.
If you’re using a production server of SQL Server and SSRS, you can configure them to use HTTPS. For details, see Microsoft SQL Server and SSRS documentation, such as https://msdn.microsoft.com/en-us/library/ms345223.aspx.
The configuration wizard populates the report URLs automatically. If you had specified to use an existing SQL Server instance, the configuration wizard retrieves the existing web service URL and report manager URL for your SQL Server instance.
For an existing SQL Server instance, you can open the Microsoft Reporting Services Configuration Manager to view the Web Service and Report Manager URLs.
-
Click Next to continue.
-
-
Choose domain or zone reporting:
Specify whether you want to choose data for reporting based on domains or zones. The default is domain-based reporting.
Click Next to continue. If you selected domain-based reporting, proceed to the next step. For zone-based reporting, go to Step 8.
-
If you selected domain-based reporting:
-
In the Monitored Domain(s) screen, you can review and edit the list of domains that will be included for reporting. Add or remove domains as desired.
For each domain, the configuration wizard lists the domain name and the domain controller name.
-
Click Next to continue.
-
-
If you selected zone-based reporting and you use hierarchical zones:
-
If you want data from all zones, select Monitor all hierarchical zones from forest(s). You can add or edit forests by clicking Edit and then adding or removing forests.
-
Or, if you want to report data from specific zones, select Monitor only specific hierarchical zones.
-
Click Edit.
The Specify Forest for zone selection dialog box opens.
-
Enter the forest name where the desired zones are and click OK.
The Edit Monitored Hierarchical Zones dialog box opens.
-
Enter the hierarchical zones by name, or expand the list of zones to locate the desired zones manually.
-
If desired, specify to select the parent or child zones automatically.
-
Select the zone by putting a checkmark in the box next to the zone name.
-
When you’re done specifying which hierarchical zones to monitor, click OK to close the dialog box and return to the Configuration wizard.
Each zone that you’ve selected is listed in the Hierarchical Zones screen.
-
Click Next to continue.
-
-
If you selected zone-based reporting and you use classic zones:
-
If you want data from all zones, select Monitor all classic zones from forest(s). You can add or edit forests by clicking Edit and then adding or removing forests.
-
Or, if you want to report data from specific zones, select Monitor only specific classic zones.
-
Click Edit.
The Specify Forest for zone selection dialog box opens.
-
Enter the forest name where the desired zones are and click OK.
The Edit Monitored Classic Zones dialog box opens.
-
Select the classic zones to include in your reports. Select the zone by putting a checkmark in the box next to the zone name.
You can filter the list of zones by entering a portion of the name and clicking Filter.
-
When you’re done specifying which classic zones to monitor, click OK to close the dialog box and return to the wizard. Click Next to continue.
-
-
For zone-based reporting, you can also specify which domain controller(s) that the report service connects to.
If you don’t specify which domain controller(s) to use, report services will use the default domain controller.
-
Click Add.
The Add Domain Controller dialog box opens.
-
Enter the domain name and then select the domain controller from the list.
-
Click OK to return to the Configuration wizard.
The domain controllers that you selected are listed in the wizard screen.
-
Click Next to continue.
-
-
In the Synchronization schedule screen, specify how often you want the reporting service to pull data from Active Directory.
You can specify that the service synchronizes weekly, daily, every certain number of days, or every certain number of hours. The limit is 32,767 days or weeks.
Click Next to continue.
-
Configure the user account that runs the service:
-
In the Report Services options screen, specify the user account that will be used to run the service that synchronizes data from Active Directory and the reporting database.
You can select a network service account, a managed service account, or another user account in Active Directory.
You must specify a user account that has the required permissions. The configuration wizard verifies that the user has the correct level of access.
-
Click Next to continue.
-
The configuration wizard verifies that the specified user account has the required permission. An error displays if the permissions are inadequate.
-
If the permission verification is successful, click Close to close the Verify permission window.
-
-
Review and complete the installation:
-
In the Summary screen, review the installation details. If the installation settings are correct, click Next to continue.
If you’re installing a new database, it may take a few minutes.
-
(Optional) In the completion screen, if the installation is successful, you can select the option to synchronize Active Directory data with the report database immediately. Depending on the Active Directory configuration and domain size, this operation can take awhile to complete.
Or, alternatively, you can run the synchronization at a more convenient time, using the Report Services Control Panel.
-
Click Finish to close the configuration wizard.
If the configuration was not successful, the configuration wizard provides some notes as to why the configuration failed. The notes may or may not include knowledge base articles that are available at the Delinea Technical Support web site.
-
Configuring a PostgreSQL Report Services Deployment
Follow these instructions if you're creating a new report services deployment using PostgreSQL or reconfiguring an existing PostgreSQL report services deployment.
To configure report services with a PostgreSQL database:
-
If you need to start the Delinea Report Services configuration wizard, go to the Start menu > All Programs > Centrify Server Suite 2021.1 > Report Services, and choose Configuration Wizard.
If you’re continuing from the Delinea Management Services installer, the installer started the configuration wizard for you.
-
On the Welcome screen, click Next to continue.
-
If you have already set up report services, the Reconfiguring Report Services screen displays. Select Reconfigure and click Next to continue.
-
On the Database Type screen, select PostgreSQL and click Next to continue.
-
On the PostgreSQL screen, specify to create a new PostgreSQL installation or use an existing one.
Because PostgreSQL doesn't have instances the way other databases do, Delinea recommends that you use an existing PostgreSQL database, if you already have one set up.
For existing PostgreSQL installations, go to Step 8. Otherwise, for new installations, continue to Step 6.
-
To install a new PostgreSQL server, specify the PostgreSQL installer file location. You must specify a PostgreSQL installer version 11 or later. You can find the installer file in Common\PostgreSQL.
Click Next to continue.
-
Specify the location of the PostgreSQL ODBC driver installer file. Delinea includes this file with the report services installer in Common\PostgreSQL.
If you already have the official PostgreSQL ODBC drivers installed, this screen doesn't display.
Click Next to continue.
-
Specify the PostgreSQL database settings:
-
ODBC Driver: For the PostgreSQL version that comes with report services, keep the default setting of PostgreSQL Unicode. This field can't be changed for new installations.
-
Server: If you're using an existing PostgreSQL server, enter the server name. For example, localhost or servername.acme.com.
-
Port: If you don't enter a port number, report services uses the default port 5432.
-
Database: This is the database name. The name can be up to 63 characters long, and the name cannot begin with an underscore (_) or dollar sign ($), and the instance name cannot contain any of the following special characters: a blank space, backslash (\), comma (,), colon (:), semi-colon (;), single quotation mark ('), ampersand (&), hyphen (-), number sign (#), or at sign (@).
-
Database User: This is your PostgreSQL administrator user. If you're using an existing PostgreSQL installation, the user must have the Create Database permission.
-
Password: This is the password for your PostgreSQL administrator user. If you're using an existing PostgreSQL installation, this is the password for the user with the Create Database permission.
-
Confirm Password: If you're creating a new installation, enter your password again to ensure the password is correct.
-
Additional Parameters: Enter as needed. If you need to enter multiple characters, separate them with a colon (:).
The Configuration wizard verifies these settings after you've continued through all the configuration screens. Also, if you haven't installed the PostgreSQL ODBC driver, the Configuration wizard cannot verify these database settings.
-
-
If you selected domain-based reporting:
-
In the Monitored Domain(s) screen, you can review and edit the list of domains that will be included for reporting. Add or remove domains as desired.
For each domain, the configuration wizard lists the domain name and the domain controller name.
-
Click Next to continue.
-
-
If you selected zone-based reporting and you use hierarchical zones:
-
If you want data from all zones, select Monitor all hierarchical zones from forest(s). You can add or edit forests by clicking Edit and then adding or removing forests.
-
Or, if you want to report data from specific zones, select Monitor only specific hierarchical zones.
-
Click Edit.
The Specify Forest for zone selection dialog box opens.
-
Enter the forest name where the desired zones are and click OK.
The Edit Monitored Hierarchical Zones dialog box opens.
-
Enter the hierarchical zones by name, or expand the list of zones to locate the desired zones manually.
-
If desired, specify to select the parent or child zones automatically.
-
Select the zone by putting a checkmark in the box next to the zone name.
-
When you’re done specifying which hierarchical zones to monitor, click OK to close the dialog box and return to the Configuration wizard.
Each zone that you’ve selected is listed in the Hierarchical Zones screen.
-
Click Next to continue.
-
-
If you selected zone-based reporting and you use classic zones:
-
If you want data from all zones, select Monitor all classic zones from forest(s). You can add or edit forests by clicking Edit and then adding or removing forests.
-
Or, if you want to report data from specific zones, select Monitor only specific classic zones.
-
Click Edit.
The Specify Forest for zone selection dialog box opens.
-
Enter the forest name where the desired zones are and click OK.
The Edit Monitored Classic Zones dialog box opens.
-
Select the classic zones to include in your reports. Select the zone by putting a checkmark in the box next to the zone name.
You can filter the list of zones by entering a portion of the name and clicking Filter.
-
When you’re done specifying which classic zones to monitor, click OK to close the dialog box and return to the wizard. Click Next to continue.
-
-
For zone-based reporting, you can also specify which domain controller(s) that the report service connects to.
If you don’t specify which domain controller(s) to use, report services will use the default domain controller.
-
Click Add.
The Add Domain Controller dialog box opens.
-
Enter the domain name and then select the domain controller from the list.
-
Click OK to return to the Configuration wizard.
The domain controllers that you selected are listed in the wizard screen.
-
Click Next to continue.
-
-
In the Synchronization schedule screen, specify how often you want the reporting service to pull data from Active Directory.
You can specify that the service synchronizes weekly, daily, every certain number of days, or every certain number of hours. The limit is 32,767 days or weeks.
Click Next to continue.
-
Configure the user account that runs the service:
-
In the Report Services options screen, specify the user account that will be used to run the service that synchronizes data from Active Directory and the reporting database.
You can select a network service account, a managed service account, or another user account in Active Directory.
You must specify a user account that has the required permissions. The configuration wizard verifies that the user has the correct level of access.
-
Click Next to continue.
-
The configuration wizard verifies that the specified user account has the required permission. An error displays if the permissions are inadequate.
-
If the permission verification is successful, click Close to close the Verify permission window.
-
-
Review and complete the installation:
-
In the Summary screen, review the installation details. If the installation settings are correct, click Next to continue.
If you’re installing a new database, it may take a few minutes.
-
(Optional) In the completion screen, if the installation is successful, you can select the option to synchronize Active Directory data with the report database immediately. Depending on the Active Directory configuration and domain size, this operation can take awhile to complete.
Or, alternatively, you can run the synchronization at a more convenient time, using the Report Services Control Panel.
-
Click Finish to close the configuration wizard.
If the configuration was not successful, the configuration wizard provides some notes as to why the configuration failed. The notes may or may not include knowledge base articles that are available at the Delinea Technical Support web site.
Delinea Report Services does not include a reporting solution for use with PostgreSQL.
-
Changing the Monitoring Mode for an Existing Report Services Deployment
You can easily switch from gathering report data based on domains or zones.
To change the monitoring mode for an existing report services deployment:
-
If you need to start the Delinea Report Services configuration wizard, go to the Start menu > All Programs > Centrify Server Suite2021.1 > Report Services, and choose Configuration Wizard.
If you’re continuing from the Delinea Management Services installer, the installer started the configuration wizard for you.
-
On the Welcome screen, click Next to continue.
-
On the Reconfiguring Report Services screen, select Switch the monitor mode if you want to change whether report services uses domains or zones to synchronize Active Directory data. Click Next to continue.
-
On the Switch Monitor Mode screen, review the current and new mode settings. Click Next to continue.
- To switch to domain-based reporting, go to Step 5.
- To switch to zone-based reporting for hierarchical zones, go to Step 6.
- To switch to zone-based reporting for classic zones, go to Step 7.
-
If you selected domain-based reporting:
-
In the Monitored Domain(s) screen, you can review and edit the list of domains that will be included for reporting. Add or remove domains as desired.
For each domain, the configuration wizard lists the domain name and the domain controller name.
-
Click Next to continue.
-
-
If you selected zone-based reporting and you use hierarchical zones:
-
If you want data from all zones, select Monitor all hierarchical zones from forest(s). You can add or edit forests by clicking Edit and then adding or removing forests.
-
Or, if you want to report data from specific zones, select Monitor only specific hierarchical zones.
-
Click Edit.
The Specify Forest for zone selection dialog box opens.
-
Enter the forest name where the desired zones are and click OK.
The Edit Monitored Hierarchical Zones dialog box opens.
-
Enter the hierarchical zones by name, or expand the list of zones to locate the desired zones manually.
-
If desired, specify to select the parent or child zones automatically.
-
Select the zone by putting a checkmark in the box next to the zone name.
-
When you’re done specifying which hierarchical zones to monitor, click OK to close the dialog box and return to the Configuration wizard.
Each zone that you’ve selected is listed in the Hierarchical Zones screen.
-
Click Next to continue.
-
-
If you selected zone-based reporting and you use classic zones:
-
If you want data from all zones, select Monitor all classic zones from forest(s). You can add or edit forests by clicking Edit and then adding or removing forests.
-
Or, if you want to report data from specific zones, select Monitor only specific classic zones.
-
Click Edit.
The Specify Forest for zone selection dialog box opens.
-
Enter the forest name where the desired zones are and click OK.
The Edit Monitored Classic Zones dialog box opens.
-
Select the classic zones to include in your reports. Select the zone by putting a checkmark in the box next to the zone name.
You can filter the list of zones by entering a portion of the name and clicking Filter.
-
When you’re done specifying which classic zones to monitor, click OK to close the dialog box and return to the wizard. Click Next to continue.
-
-
For zone-based reporting, you can also specify which domain controller(s) that the report service connects to.
If you don’t specify which domain controller(s) to use, report services will use the default domain controller.
-
Click Add.
The Add Domain Controller dialog box opens.
-
Enter the domain name and then select the domain controller from the list.
-
Click OK to return to the Configuration wizard.
The domain controllers that you selected are listed in the wizard screen.
-
Click Next to continue.
-
-
Configure the user account that runs the service:
-
In the Report Services options screen, specify the user account that will be used to run the service that synchronizes data from Active Directory and the reporting database.
You can select a network service account, a managed service account, or another user account in Active Directory.
You must specify a user account that has the required permissions. The configuration wizard verifies that the user has the correct level of access.
-
Click Next to continue.
-
The configuration wizard verifies that the specified user account has the required permission. An error displays if the permissions are inadequate.
-
If the permission verification is successful, click Close to close the Verify permission window.
-
-
Review and complete the installation:
-
In the Summary screen, review the installation details. If the installation settings are correct, click Next to continue.
If you’re installing a new database, it may take a few minutes.
-
(Optional) In the completion screen, if the installation is successful, you can select the option to synchronize Active Directory data with the report database immediately. Depending on the Active Directory configuration and domain size, this operation can take awhile to complete.
Or, alternatively, you can run the synchronization at a more convenient time, using the Report Services Control Panel.
-
Click Finish to close the configuration wizard.
If the configuration was not successful, the configuration wizard provides some notes as to why the configuration failed. The notes may or may not include knowledge base articles that are available at the Delinea Technical Support web site.
-