Viewing Alert Details
Click the Alert Name to view its details panel.
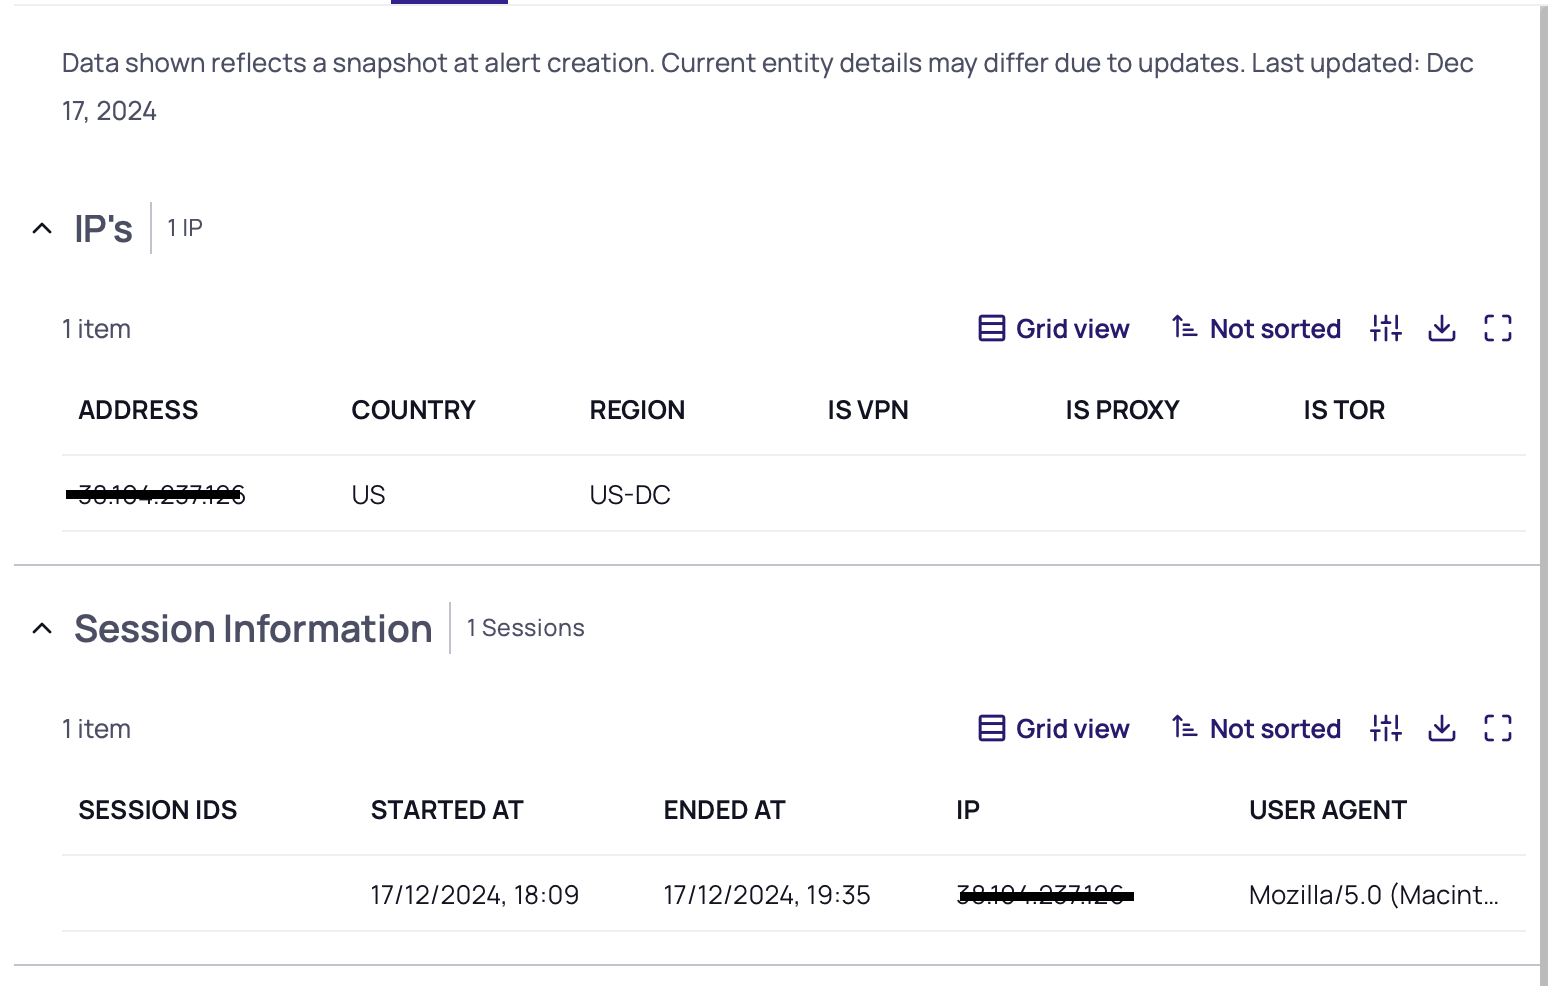
Details may differ due to updates.
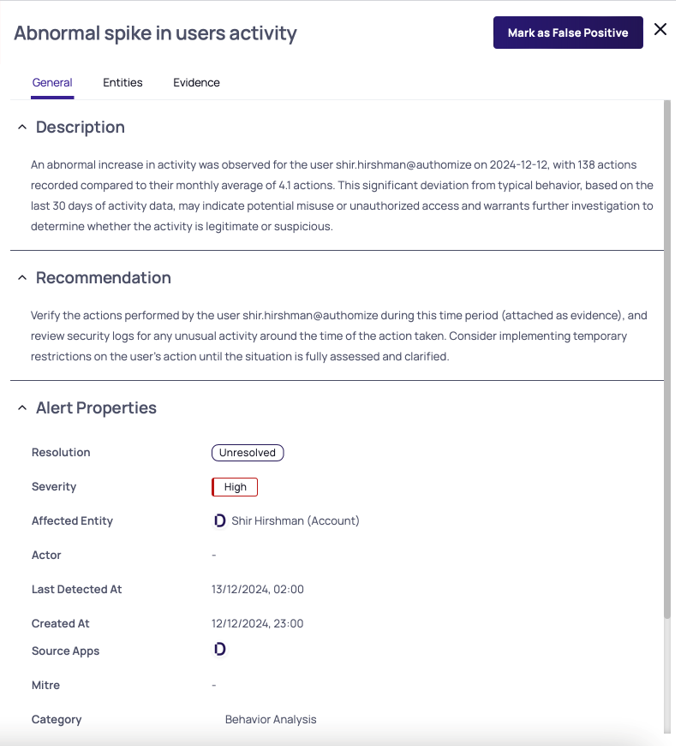
Alert Properties
| Alert Property | Description |
|---|---|
| Resolution | Status of the alert: resolved or unresolved |
| Affected entity | The entity that was affected by this alert |
| Source app | The application this alert relates to, usually the same app as of the affected entity |
| Category | The category of the alert as assigned by Delinea |
| Compliance | The compliance standards |
| Created date | The time when this alert was created |
| Severity | The severity assigned to this detection: low, medium, or high |
| Last Detected at | The last time the system scanned the issue |
| MITRE | The MITRE tactics the alert relates to |
| Resolved at | The date this alert status changed to resolve, the alerts passed the active time, manually resolved by the customer or the system detected that the issue is no longer happening |
| Source app name | The application where the issue was detected |
| Entity origin id | The ID of the entity (e.g.,assets, account, etc) in the source application |
| Alert description | The description of the individual alert, indicating what happened |
| Alert recommendation | What Delinea suggests to do in order to resolve the alert |
| Actor name | The entity/IP that performed the action in the alert |
| Actor type | The type of actor as listed in the alert (usually a user or service account) |
In addition to the basic descriptions of alert properties, additional controls are available using the tabs in the Alerts page.
General Tab
Provides details about what was detected, as well as general alert properties. For a description of the columns in this tab, see Inventory Filter Properties.
Entities Tab
Displays the entities that are affected or related to the alert or the actor who caused the issue. Alerts can be connected to the following types of entities:
-
Affected: Who was affected by the detection
-
Actor: The person or IP who performed the action detected in the alert
-
Related: Anything or anyone that was related to the alert but not affected directly
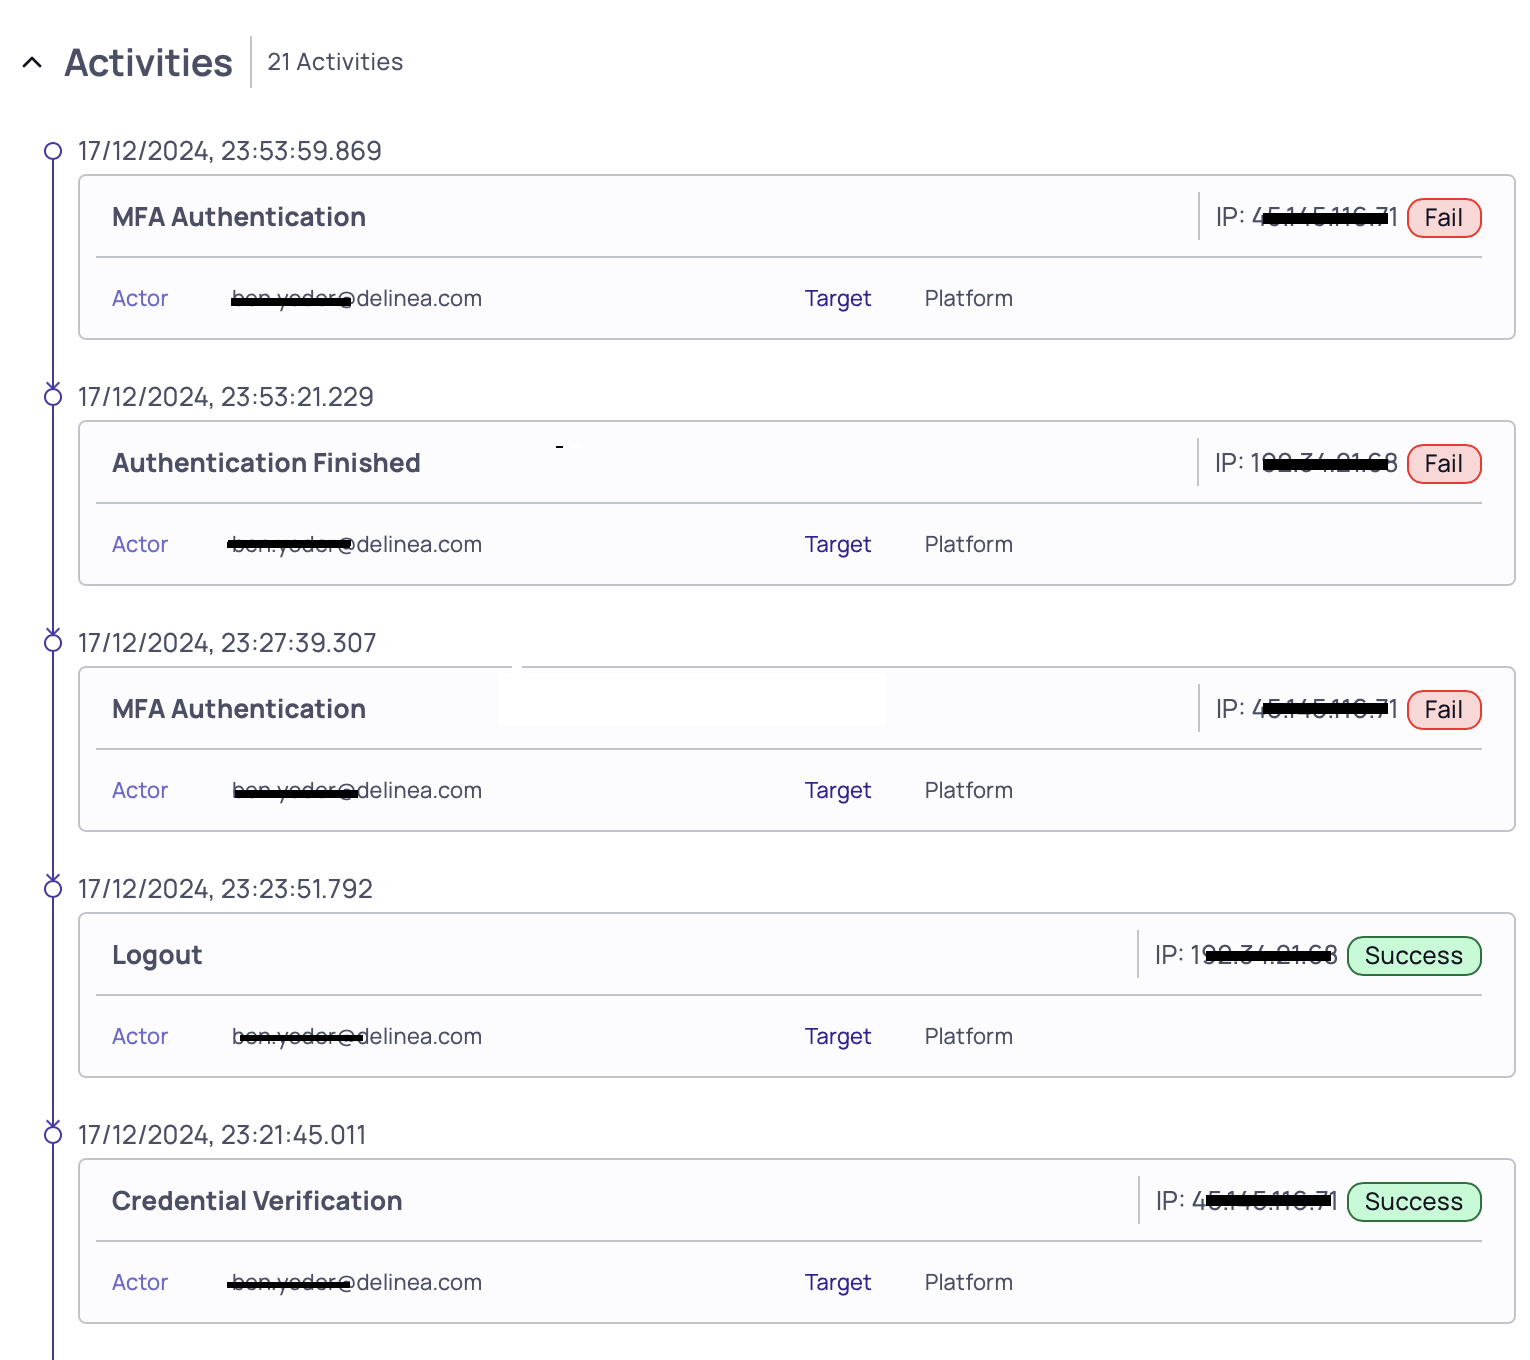
Evidence Tab
Displays static information that can help you understand what happened and what data the Delinea Platform had at the moment the alert was detected; for example, user IP information, session details, or a map showing the user baseline locations with the detected suspicious location. The different types of evidence give details about the alert and the information used to detect it.
Evidence for alerts can include the following types of contexts:
-
Related activities: Timeline of the actions/activities that were taken and found to be either the root cause of the alert or related to the alert. Each line represent an action taken by a user in the system.
-
IPs: Aggregated list of IPs that were included in the alert. For each IP, extra information is displayed, such as the location.
-
Sessions: List of sessions related to the alert. The list can be a single session or multiple sessions. Each has a start and end time and represents the timeframe when the user was active in the system. Each session can come from a different IP and user-agent. This data will be shown in this context.
-
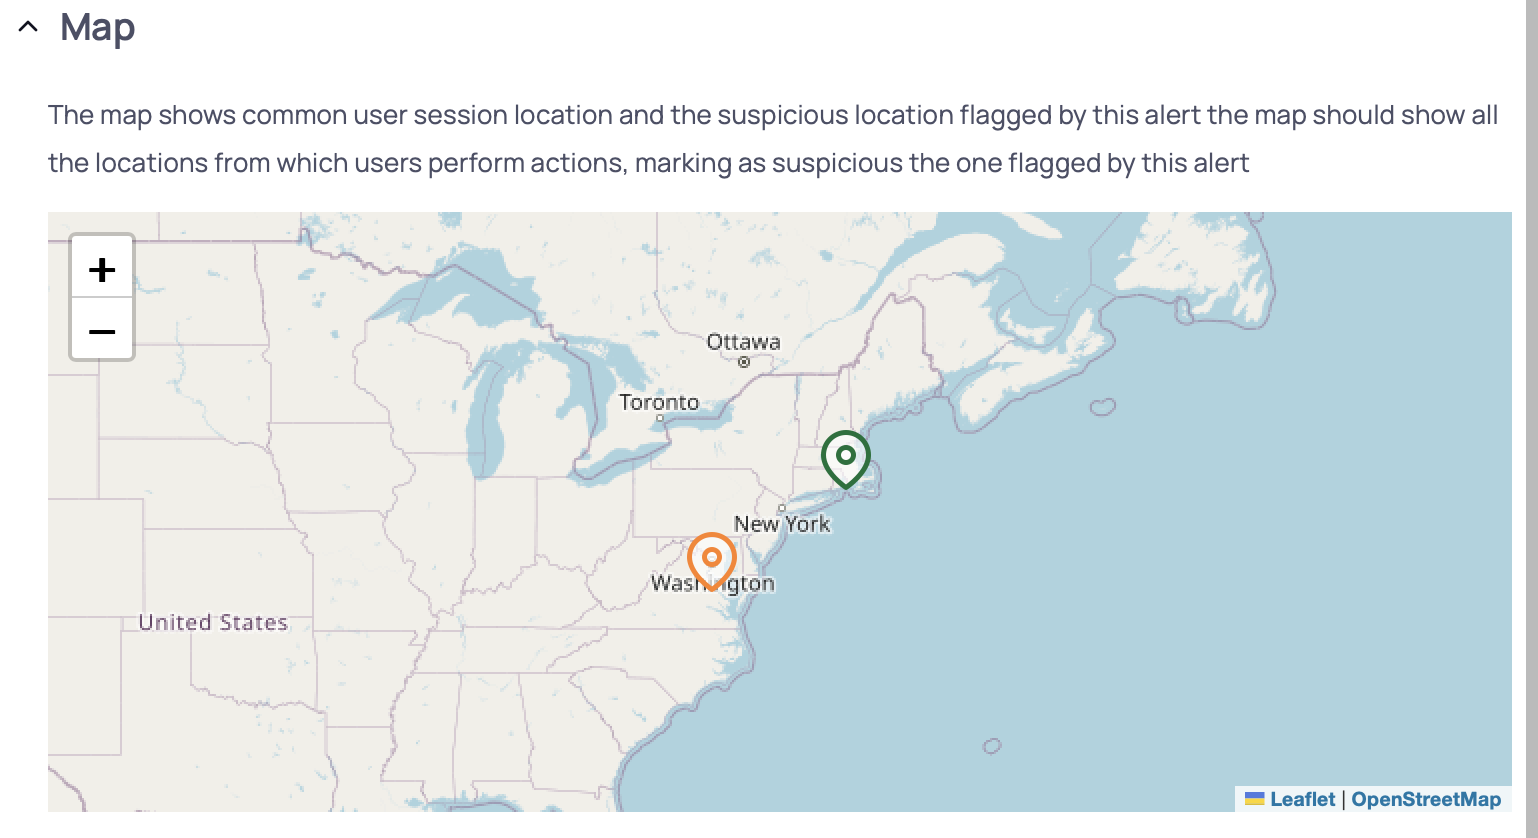
Map: User locations. The map can show common locations and suspicious locations. Common locations are marked in green, and suspicious locations are marked in orange.
-
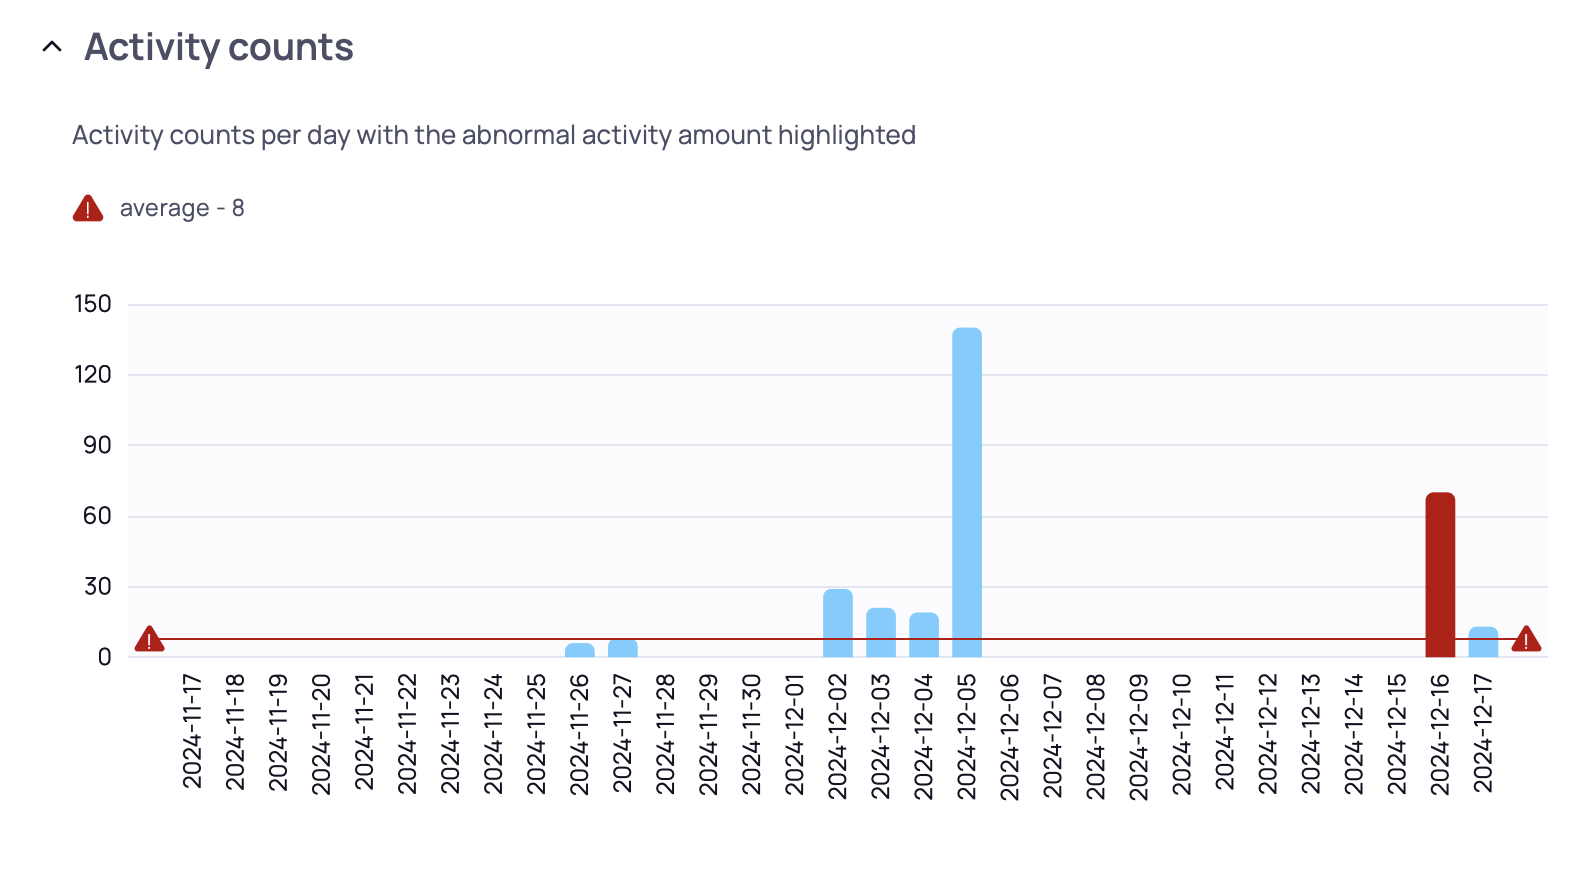
Burst of activities: Bar chart showing user activities over time. For example, this can show a historical baseline of the user's administrative activities over a period of a month and highlight (in red) the anomalous day.
-
Heatmap: Chart that usually shows users sessions over a period of 30 days. This chart is used to show when the user is active, the session duration, and if available, lower and upper thresholds for the user activity time.
-
Suspicious activities breakdown: Chart that is part of the
Abnormal spike in users activityalert. Shows all activities, grouped by type, that were performed by the user on the day the Delinea Platform detected a spike in activity.