Managing Reports
You can create reports to find out specific information about your data and then share that information with other Privileged Access Service administrators. A report is a SQL query against your database tables and the results that the query generates. You can create reports as a way to find out specific information about your data: applications, devices, users, roles, connectors, and so forth.
You can use the default, built-in reports, or you can search for specific kinds of data by building your own report queries. You can also share reports with your other Privileged Access Service administrators.
What’s in the Report Library
Use the Reports page to view, create, and share your reports. When you click Reports, the page opens to the My Reports folder. This folder lists all of the reports you have created. If you have not created any reports of your own, you might want to start by browsing through the predefined reports provided in the Builtin Reports folder and its subfolders. For example, if you expand the Builtin Reports folder and select the Mobile subfolder, you would see a list of the prebuilt reports for mobile devices.
Admin Portal provides the following folders to store reports:
- Builtin Reports: Admin Portal provides some prebuilt reports in this folder. You can specify parameters, such as date ranges, for some reports. These built-in reports demonstrate the kinds of data you can gather and display in your reports. You can copy these reports into your My Reports folder or the Shared Reports folder. After you copy a report to another location you can then modify the report.
- My Reports: When you create a new report or modify a report, Admin Portal saves it here. You can also copy built-in or shared reports to this folder so that you have all the reports that you use in one place. Only you can see the reports in your My Reports folder. You can also export, move, or delete reports in this folder.
- Shared Reports: To share reports with other administrators, you move or copy the reports here.
Exporting a report creates a file on your computer; you can specify either CSV or Microsoft Excel format. Copying a report duplicates the report into another reports folder.
Access to Shared Reports and Report Data
When you view a report, you can only read the data that you have permission to access. If you don’t have read permission to a particular kind of data, such as applications, devices, or users, then the report doesn’t display that information for you. (Permissions are granted to roles by the sysadmin—see Admin Portal Administrative Rights for the details.
The report doesn’t indicate any limitations to that user’s permissions. This means that people with different permissions can view the same report but see different results.
You can share any report in the Shared Reports folder. Sharing a report involves assigning it to specific roles and also to the folder(s) that contain the report.
When you assign a report or a report folder to a role, you also specify the level of access that the role has—read access, read and write access, or owner access. If you specify a role as an owner of a report or a report folder, then that role can modify, rename, share, or delete the report.
There are three kinds of access permission for reports:
- The level of access to the report definition
- Access to the data that is read by the report
- Access to the folder that contains the report
The report access level determines whether you can read, copy, modify, or share the report definition.
You can create reports in the Shared Reports folder, or you can copy reports from either the My Reports or Builtin Reports folders into the Shared Reports folder.
When you modify a report in the Shared Reports folder, you can also assign the report to roles. When you assign the report to a role, you also specify what the administrators in that role can do with the report by specifying either the Read, Read and Write, or Owner access. You also specify similar levels of access for the report folders.
- Read: Administrators can view and copy the report, but they cannot modify it, move it, or share it.
- Read and Write: Administrators can view, copy, move, and modify the report.
- Owner: Administrators can view, copy, move, and modify the report. Administrators can also grant other administrators access to the report.
At the minimum, you need to assign administrators to a role with at least the Read Only System Administration permission to enable them to view built-in and their own reports.
To share reports, you need to assign administrators to a role with Report Management permission.
However, you also need to grant administrators access to the types of data that you want them to view in the report. Administrators do not see report data for which they do not have permission to view.
Administrators can always view report data related to their own mobile devices.
For example, if an administrator has the Application Management permission but not the Device Management permission, when that administrator opens a report that generates both application and device results, the administrator sees only the application data.
How to Create a New Report
You can create new reports using SQL and parameters. Using parameters in your SQL query allows you to run the same report against different values instead of creating multiple reports.
To create a new report:
-
Log in to Admin Portal.
-
Click Reports > New Report.
-
Enter a name for your report.
Names can contain letters, numbers, and underscores. Do not include special characters or white space.
-
Use the Data Dictionary column drop-downs to define what you want the report to display.
The data dictionary has a list of all tables. After you select a column, tables not valid for a join are automatically disabled. If more than two tables are joined, and one table no longer has any filters and columns, then only tables that can be joined together will remain selected and in the SQL. For example, if A is joined to B is joined to C, and B is removed, and A and C cannot be joined, then only A will remain in the SQL.
You can click the filter icon associated with each column to specify conditions for filtering on that column. Only the IN and NOT IN operations allows for multiple values.
-
(Optional) Use the script editor to manually build your report.
See "Report Query Syntax" for help with syntax.
Write SQL queries that use parameters for arguments rather than concrete values. This will allow you to run the same report against different values. For example, you can write the following SQL query:
select username, lastlogin from user where username like @userParam
You now must define the “userParam” parameter to make use of the query.
-
Click Parameters to specify parameters.
Parameters allow you to define a report with different values. Parameters you specify must be paired with your SQL query. In our example, the SQL query in the above step uses the “userParam” parameter, so you must define the same parameter here.
-
Click Settings to configure the report options:
- Reports can be displayed on a map -- Enable this option to display the data on a map if the report is location related.
- Validate reports on save (enabled by default) -- Enable this option to validate the SQL syntax when you save the report.
-
Click Save.
Admin Portal saves your report to the Reports section.
When you run the report, you will be prompted for the parameter value(s) that correspond to the parameter(s) you have defined. For example, you can enter d% to get usernames starting with the letter d if you have defined a username parameter and written a corresponding SQL query.
Selecting Report Data
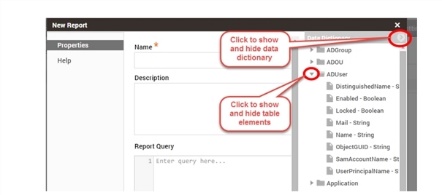
You can open the data dictionary to see the tables and column names that you can use in your reports. When you create a report, you open the Data Dictionary by clicking the >> button in the upper right area of the screen.
With the Data Dictionary visible, you can find the column names in a particular table by clicking the triangle next to a table name. The Data Dictionary provides table names, column names, and data types so that you know what to enter in your SQL query.
Although there are other tables in the database that you can use in your reports, the tables mentioned below are likely to be the most useful to you.
- ADUser: The Active Directory User table stores some basic information related to users, such as SamAccountName, UserPrincipalName, Mail, and so forth.
- Application: Stores information related to web and mobile applications, such as web application type, mobile application type, application version, and so forth.
- Device: Stores information related to mobile devices and Mac computers, such as operating system version, noncompliant status, and when the device last connected with the Privileged Access Service
- Event: Stores activity information related to applications, devices, and users, such as counts for application launches, logins, device types, and so forth.
When creating queries with the Event table, you must specify a time boundary. There are too many records in the Event table to query all records. For details, see "Filtering events by time with DateFunc()".
Report Query Syntax
Creating the query for a report involves using SQL statements. SQL is a Structured Query Language for retrieving data from databases. SQL statements can be simple or complex, depending on the data that you want to find and how you want it to display. The key is to know what you want to see in your report, and understanding what kind of data is available to you.
For example, here’s a simple SQL statement:
SELECT Owner FROM Device
This query looks for the listed owners of registered mobile devices, as recorded in the Owner column of the Device table.
The main component of a SQL query is the SELECT statement. SELECT does just that - it selects which data to display. You can select one or more columns from one or more tables to retrieve. You can use any of the following SELECT statements in Admin Portal report queries:
- SELECT: Selects data from the specified columns in the specified tables.
- SELECT *: Selects all records from the specified table.
- SELECT DISTINCT: Selects the unique records from the specified columns in the specified tables. The DISTINCT keyword trims out the duplicate records.
If you want to look at columns in different tables, you can also combine the results by using UNION or one of the JOIN statements.
In addition to selecting the database tables to retrieve, you can also provide conditions to further refine your query results. You can use any of the following SQL statements to specify conditions:
-
AND / OR: Selects data that meets both conditions (AND) or one of the specified conditions (OR).
-
BETWEEN: Use BETWEEN to select results that are within a specified range.
-
IN / NOT IN: Use IN or NOT IN to specify multiple values in a WHERE clause.
-
LIKE: Use LIKE to search for a specified pattern in a column.
-
WHERE: Use WHERE to specify criteria to filter for, such as column values and so forth.
Admin Portal uses a subset of SQL-92 that only supports SELECT statements. SQL commands that change database values are not valid (CREATE, ALTER, DELETE, DROP, INSERT, SELECT INTO, TRUNCATE, UPDATE, and so forth).
Filtering Events by Time with DateFunc()
When you query the Event table, you must include a time boundary to limit your query results. Admin Portal provides a DateFunc() SQL function to filter events based on time.
The time span argument of DateFunc allows you to specify a combination of days, hours, minutes, and seconds. Its most generic form is:
‘[-]d.hh:mm:s’
The leading ‘-‘ is optional. Days supports any number of digits, seconds supports 1 or 2 digits, and hours and minutes require 2 digits. It also supports the following forms so you don’t have to use place holders for unneeded data:
Days: ‘[-]d’ (equivalent to [-]d.00:00:00)
Hours/minutes: ‘[-]hh:mm’ (equivalent to [-]0.hh:mm:00)
Hours/minutes/seconds” ‘[-]hh:mm:s’ (equivalent to [-]0.hh:mm:s)
Examples of placeholders
- Last week: ‘-7’
- Next 2 hours: ’02:00’
- Last 90 mins and 30 seconds: ‘-01:30:30’
- Last 7 days, 7 hours, 7 minutes, 7 seconds: ‘-7.07:07:7’
| Description | SQL Query |
|---|---|
| Events that occurred in the last 30 days | select WhenOccurred, FailUserName, FromIPAddress from event where EventType = 'Cloud.Core.LoginFail' and whenoccurred >= DateFunc('now','-30') |
| Events that occurred in the last 24 hours | Select WhenOccurred,EventType from Event where WhenOccurred > datefunc('now', '-1') |
| Events that occurred in the last 48 hours | Select * from Event where WhenOccurred > DateFunc('now', '-2') |
| Events that occured in the last 54 hours | Select * from Event where WhenOccurred > DateFunc('now', '-2.06:00') |
| Events that occurred on or before August 7, 2013 | select WhenOccurred, UserName, FromIPAddress, AuthMethod, Factors from Event where EventType = 'Cloud.Core.Login' and WhenOccurred > datefunc('now', -7) |
| Events that occurred yesterday | select eventtype,WhenOccurred from event where whenoccurred>datefunc('now', '-3') and whenoccurred < datefunc('now', '-2') |
DateFunc Syntax
Use the following syntax:
DateFunc( <stringdate>, [<offset>])
where
<stringdate> can be one of the following three options:
- 'now' - this means now (current time)
- 'today' - this means the start of today (current day)
- <date string> - a string that represents a specific date and time, such as '09.30.2016:01:00'.
<offset> is a string representing an offset.
-
-n means minus n days
-
-5:00 means minus 5 hours
Privileged Access Service operates using UTC time and displays in local time. So, “today” means the start of today according to UTC time, and ‘3:15’ means 3:15 today in UTC time. For example, if you specify ‘3:15’ while you’re in California during Daylight Savings Time, you’re actually specifying 8:15 am UTC time.
Formatting Dates to Strings with Formatdate()
You can use the Formatdate() function to convert a date to a string. Use the following syntax:
formatdate(<date>, <format_string>)
For example, to extract the month number from a date, use the following syntax:
formatdate(<date>,”MM”)
If you process a date in November through the above example, it returns an “11” to indicate November.
Common Events that You Can Search For
When collecting information from the Event table, you specify types of events that you want to have in your report. Here’s a list of the most common types of events that you might see in the Event table.
Cloud.Saas.ApplicationLaunch
Cloud.Saas.Application.AppLaunch
Cloud.Saas.Application.AppAdd
Cloud.Saas.Application.AppModify
Cloud.Saas.Application.AppDelete
Cloud.Saas.Application.SamlResponseGenerate
Cloud.Saas.Application.WsFedSamlResponseGenerate
Cloud.Saas.ProfileUpdate
Cloud.Saas.PasswordChange
Cloud.Core.Login
Cloud.Core.Login.MultiFactorChallenge
Cloud.Core.Login.MultiFactorChallenge.MultiFactorResponse
Cloud.Core.LoginFail
Cloud.Core.Logout
Cloud.Core.SamlTokenValidate
Cloud.Core.SamlTokenValidateFail
Cloud.Core.Access.Role.Create
Cloud.Core.Access.Role.Edit
Cloud.Core.Access.Role.Delete
Cloud.Core.Access.CheckRightsFailure.Table
Cloud.Core.Access.CheckRightsFailure.Table.Row
Cloud.Mobile.Enroll
Cloud.Mobile.StateChange
Cloud.Mobile.AppChange
Cloud.Mobile.DeviceAction
Cloud.Mobile.Device.DeviceAction
Cloud.Mobile.Device.AppChange
Cloud.Mobile.Device.StateChange
Cloud.Mobile.Device.Enroll
Cloud.Mobile.GpChangeDetected
Working with Reports
When you open a report, use the Actions menu to invoke the following commands:
| Action menu command | To do this |
|---|---|
| Run | Run a new report with a different set of parameters. |
| Add To Set | Adds the report to the specified set. |
| Modify >Note: The option name will be Details for built-in reports. | Display the reports details and set the following properties: Report can be displayed on a map Validate report on save The details include the report name, description, and SQL query. You can generate a preview of the results in this option too. |
| Email Report | Send the query results to an email account. You can send the data as an Excel spreadsheet or HTML table. |
| Export Report | Save the SQL script in a CSV or Excel spreadsheet file. |
| Copy | Copy the report. |
Viewing Reports
When viewing a report, you can click any column heading to sort by that column. You can also click and drag a column heading to move it and adjust the column widths.
To view a report:
- On the Reports page, select a report to open it.
- Choose the parameters you want to use for your report.
- Your report information will display once the parameters window closes.
Modifying Applications or Devices Directly from a Report
If your report includes web applications or devices in the report results, you can click a specific application or device to see the details for that object. This works when a specific object (device ID or application name) displays in the result set, not a grouping of objects.
For example, if you create a report that lists a mobile device ID, you can right-click the Device ID and perform device-related actions - such as delete, update policies, unregister, and so forth.
Exporting Report Data
You can export reports to a CSV or Microsoft Excel file.
To export a report
- From Reports, open a report that you want to export.
- Click Actions > Export Report.
- Choose a file type and enter a filename, then click OK.
How to Create a new Report
You can create new reports using SQL and parameters. Using parameters in your SQL query allows you to run the same report against different values instead of creating multiple reports.
To create a new report:
-
Log in to Admin Portal.
-
Click Reports > New Report.
-
Enter a name for your report.
Names can contain letters, numbers, and underscores. Do not include special characters or white space.
-
Use the Data Dictionary column drop-downs to define what you want the report to display.
The data dictionary has a list of all tables. After you select a column, tables not valid for a join are automatically disabled. If more than two tables are joined, and one table no longer has any filters and columns, then only tables that can be joined together will remain selected and in the SQL. For example, if A is joined to B is joined to C, and B is removed, and A and C cannot be joined, then only A will remain in the SQL.
You can click the filter icon associated with each column to specify conditions for filtering on that column. Only the IN and NOT IN operations allows for multiple values.
-
(Optional) Use the script editor to manually build your report.
See "Report Query Syntax" for help with syntax.
Write SQL queries that use parameters for arguments rather than concrete values. This will allow you to run the same report against different values. For example, you can write the following SQL query:
select username, lastlogin from user where username like @userParam
You now must define the “userParam” parameter to make use of the query.
-
Click Parameters to specify parameters.
Parameters allow you to define a report with different values. Parameters you specify must be paired with your SQL query. In our example, the SQL query in the above step uses the “userParam” parameter, so you must define the same parameter here.
-
Click Settings to configure the report options:
- Reports can be displayed on a map -- Enable this option to display the data on a map if the report is location related.
- Validate reports on save (enabled by default) -- Enable this option to validate the SQL syntax when you save the report.
-
Click Save.
Admin Portal saves your report to the Reports section.
When you run the report, you will be prompted for the parameter value(s) that correspond to the parameter(s) you have defined. For example, you can enter d% to get usernames starting with the letter d if you have defined a username parameter and written a corresponding SQL query.
Copying an Existing Report
To copy an existing report:
-
Open the Reports page.
-
Right-click the desired report and click Copy.
-
In the confirmation dialog box, click Yes.
You can copy any report you have access to.
-
Admin Portal saves a copy of the report with the same name appended with (Copy - DateTime).
Deleting a Report
You can delete a report from the Reports section.
To delete a report:
-
Right-click the desired report and click Delete.
-
In the confirmation dialog box, click Yes.
Admin Portal deletes the specified report.
Viewing Device Attributes in Report Builder
When you create a dynamic set of endpoints, you can use attributes from the Device list in Report Builder.
To view the Device attribute list in Report Builder
- In the Admin Portal, navigate to the Report Builder by clicking Reports.
- Open an existing report and click Actions > Details or click New Report to start a new report.
- In the Data Dictionary pane, click Device to expand the attribute list.
For more information on creating dynamic sets, see How to use sets to manage endpoints.
Policy-Updating Device Attributes
A subset of the Device attributes list has a unique behavior. If you use one of following attributes in a query and, subsequently, the value of that attribute changes, this will cause the device policy to update, automatically:
- Carrier
- IsAdminLocationTrackingEnabled
- Jailbroken
- Name
- OSBuild
- Owner
- OwnerID
- PhoneNumber
Report query examples: Built-in Report Definitions
Admin Portal provides some built-in reports that you can use or copy and then modify as desired. You can view the SQL statements for any of the built-in reports in Admin Portal. For convenience, here are some examples of the report definitions for several of the built-in reports so you can see examples of the SQL syntax being used.
| Report description | Query syntax |
|---|---|
| Web apps used the most often during the last 30 days | select ApplicationName as Name, count(*) as Count from Event where WhenOccurred >= DateFunc('now', '-30') and EventType='Cloud.Saas.Application.AppLaunch' group by name order by count desc |
| Web apps added and used in the last 30 days | select distinct ApplicationName from Event where eventtype='Cloud.Saas.Application.AppLaunch' and ApplicationName in (select applicationname from event where whenoccurred >datefunc('now','-30') and eventtype='Cloud.Saas.Application.AppAdd' |
| Web apps that weren't used in the last 30 days | select Name from application where DisplayName not in (select ApplicationName from Event where WhenOccurred >= DateFunc('now', '-30') and EventType='Cloud.Saas.Application.AppLaunch') and AppType = 'Web' |
| A listing of the different Android versions in use | select OSVersion,Count(*) as Count from device where InternalDeviceType = 'A' group by osversion order by count desc |
| Number of devices, organized by mobile carrier | select Carrier, count(*) as Count from device group by Carrier |
| Number of devices, organized by iOS, Mac, Android, and Windows | select case(InternalDeviceType) when 'I' then 'iOS' when 'M' then 'Mac' when 'A' then 'Android' when 'W' then 'Windows' end as Platform, Count(*) as Count from device group by InternalDeviceType order by Count desc","DisplayName":"DeviceByPlatform |
| A listing of the different iOS versions in use | select OSVersion,Count(*) as Count from device where InternalDeviceType = 'I' group by osversion order by count desc |
| All mobile apps, organized by the number of installations | select Name, Count(*) as Count from InstalledApp group by name order by count desc |
| Failed logins in the last 30 days | select WhenOccurred, FailUserName, FromIPAddress from event where EventType = 'Cloud.Core.LoginFail' and whenoccurred >= DateFunc('now','-30') |
| Users who haven't logged in during the last 30 days | select UserName, DisplayName, LastLogin from User where ID not in (select UserGUID from Event where EventType = 'Cloud.Core.Login' and WhenOccurred >= DateFunc('now', '-30')) |
| The users who have logged in the most often during the past 30 days | select NormalizedUser as User, Count(*) as Count from Event where EventType = 'Cloud.Core.Login' and WhenOccurred >= DateFunc('now', '-30') group by User order by count desc |
Report Syntax Examples
SQL Statements to Retrieve Data from Tables and Columns (basic)
| SQL Statement | Syntax | Example Statement | Example Result or Description |
|---|---|---|---|
| SELECT | SELECT column_name(s) FROM table_name | select Name from application | Use SELECT to get the data in one or more columns of a table. |
| SELECT * | SELECT * FROM table_name | select * from ADGroup | Use SELECT to get all records from a table. |
| SELECT DISTINCT | SELECT DISTINCT column_name(s) FROM table_name | select distinct ApplicationName from Event | Use SELECT DISTINCT to return just the values that are unique (distinct). Duplicate values are ignored. |
| UNION (ALL) | SELECT column_name(s) FROM table_name1 UNION SELECT column_name(s) FROM table_name2 | Use the UNION statement to combine result sets of two or more SELECT statements. Only distinct values are returned. To return all values, including duplicate values, use UNION ALL. |
SQL Components to Specify Conditions
| SQL Statement | Syntax | Example Statement | Example Result or Description |
|---|---|---|---|
| AND / OR | SELECT column_name(s) FROM table_name WHERE condition AND|OR condition | select WhenOccurred, FailUserName, FromIPAddress from event where EventType = 'Cloud.Core.LoginFail' and whenoccurred >= DateFunc('now','-30') | Use AND to combine conditions - results display if the database record meets both conditions. Use OR to show results that meet either the first or second condition. |
| BETWEEN (advanced) | SELECT column_name(s) FROM table_name WHERE column_name BETWEEN value1 AND value2 | select OSVersion,Count(*) as Count from device where InternalDeviceType = 'I' and OSVersion between '6' and '7' group by osversion order by count desc | Use BETWEEN to select results that are within a specified range. |
| IN / NOT IN | SELECT column_name(s) FROM table_name WHERE column_name IN (value1,value2,..) | select UserName, DisplayName, LastLogin from User where username not in (select NormalizedUser from Event where EventType = 'Cloud.Core.Login' and WhenOccurred >= DateFunc('now', '-30')) | Use IN to select results where a column name is one of a specified list of values (or not). |
| LIKE | SELECT column_name(s) FROM table_name WHERE column_name LIKE pattern | Select * from Users where username like ‘j%’ returns all users whose names begin with J | Use LIKE to select results that match a specified pattern. Use s to indicate the pattern. Use % for zero or more characters, and use _ (underscore) for a single character. |
| CASE (WHEN... THEN, END) | CASE X WHEN W1 THEN T1 WHEN W2 THEN T2 ELSE T3 END To evaluate the base expression multiple times: CASE WHEN X=W1 THEN T1 WHEN X=W2 THEN T2 ELSE T3 END | SELECT CASE(InternalDeviceType) WHEN 'I' THEN 'iOS' WHEN 'M' THEN 'Mac' WHEN 'A' THEN 'Android' WHEN 'W' THEN 'Windows' END as Platform, Count(*) as Count from device GROUP BY InternalDeviceType ORDER BY Count desc | Use CASE when you want to do an if/then/else statement. You can specify to have the base expression evaluated once or multiple times. |
| WHERE | SELECT column_name(s) FROM table_name WHERE column_name operator value | select ApplicationName as Name, count(*) as Count from Event where WhenOccurred >= DateFunc('now', '-30') and EventType='Cloud.Saas.Application.AppLaunch' group by name order by count desc | Use WHERE to specify the condition, such as a column name value. |
SQL Components to Specify Sorting, Displaying, Grouping
| SQL Statement | Syntax | Example Statement | Example Result or Description |
|---|---|---|---|
| AS (alias) | SELECT column_name AS column_alias FROM table_name or SELECT column_name FROM table_name AS table_alias | select Carrier, count(*) as Count from device group by Carrier | Use AS if you want to provide a different label for a column in the report results. |
| GROUP BY | SELECT Carrier, count(*) AS Count from device GROUP BY Carrier | select Carrier, count(*) as Count from device group by Carrier | Use GROUP BY to organize the report results by a specified column value. |
| ORDER BY | SELECT column_name(s) FROM table_name ORDER BY column_name [ASC|DESC] | select Name, Count(*) as Count from InstalledApp group by name order by count desc | Use SORT BY to sort the report results by a specified column value. |
SQL Function Examples
| SQL Statement | Syntax | Example Statement | Example Result or Description |
|---|---|---|---|
| HAVING | SELECT column_name, aggregate_function(column_name) FROM table_name WHERE column_name operator value GROUP BY column_name HAVING aggregate_function(column_name) operator value | Use HAVING to specify conditions when using SQL aggregate functions. (Use instead of WHERE for aggregate functions.) | |
| AVG() | SELECT AVG(column_name) FROM table_name; | Use AVG() to calculate the average value of the non-null records in the specified column. | |
| COUNT() | SELECT COUNT(column_name) FROM table_name; | select ApplicationName as Name, count(*) as Count from Event where WhenOccurred >= DateFunc('now', '-30') and EventType='Cloud.Saas.Application.AppLaunch' group by name order by count desc | COUNT (Column_name) returns the number of non-null values in the specified column. COUNT (*) returns the number of records in a table. COUNT (Distinct column_name) returns the number of distinct values in the specified column. |
| MAX() MIN() | SELECT MAX(column_name)FROM table_name; SELECT MIN(column_name)FROM table_name; | Use MAX() to return the maximum value of all values in the group. use MIN() to return the minimum, non-null value of all values in the group. The results include null values only if there are no non-null values. |
Running Reports to View Effective Rights
There are built-in Infrastructure reports that you can customize to view effective user rights based on the criteria in which you are interested. For example, you can generate a report of the permissions assigned to a user or role for a specified account, database, domain, secret, service, or system. Similarly, you can generate a report that lists all of the permissions associated with Privileged Access Service objects for a specific user or role. You can then export to a file with commaseparated values or email the report to others.
To create a report of effective rights for Privileged Access Services:
-
In the Admin Portal, click Reports.
-
Click Effective Rights to display the types of reports available.
- For Role reports list the effective rights for a selected role on different types of Privileged Access Service objects or all Privileged Access Service objects.
- For User reports list the effective rights for a selected user on different types of Privileged Access Service objects or all Privileged Access Service objects.
- Role to Object reports list the effective rights for a selected role on different types of Privileged Access Service objects.
- User to Object reports list the effective rights for a selected user on different types of Privileged Access Service objects.
-
Select the type of report, then select the type of Privileged Access Service object for which you want information.
For example, to see a complete list of the permissions granted on all Privileged Access Service objects for the members of the IT-Admin1 role, you would:
- Select For Role as the report type.
- Select Audit Admin as the role for which you want the complete list of permissions.
- Click Select.
The results are displayed in a results table.
-
Click Actions to:
- Run the report again
- Add the report to a set
- See or customize the report details
- Email the report to someone else or to a distribution list.
- Export the report to a file with comma-separated values
- Copy the report